VIKUS: Past Visions
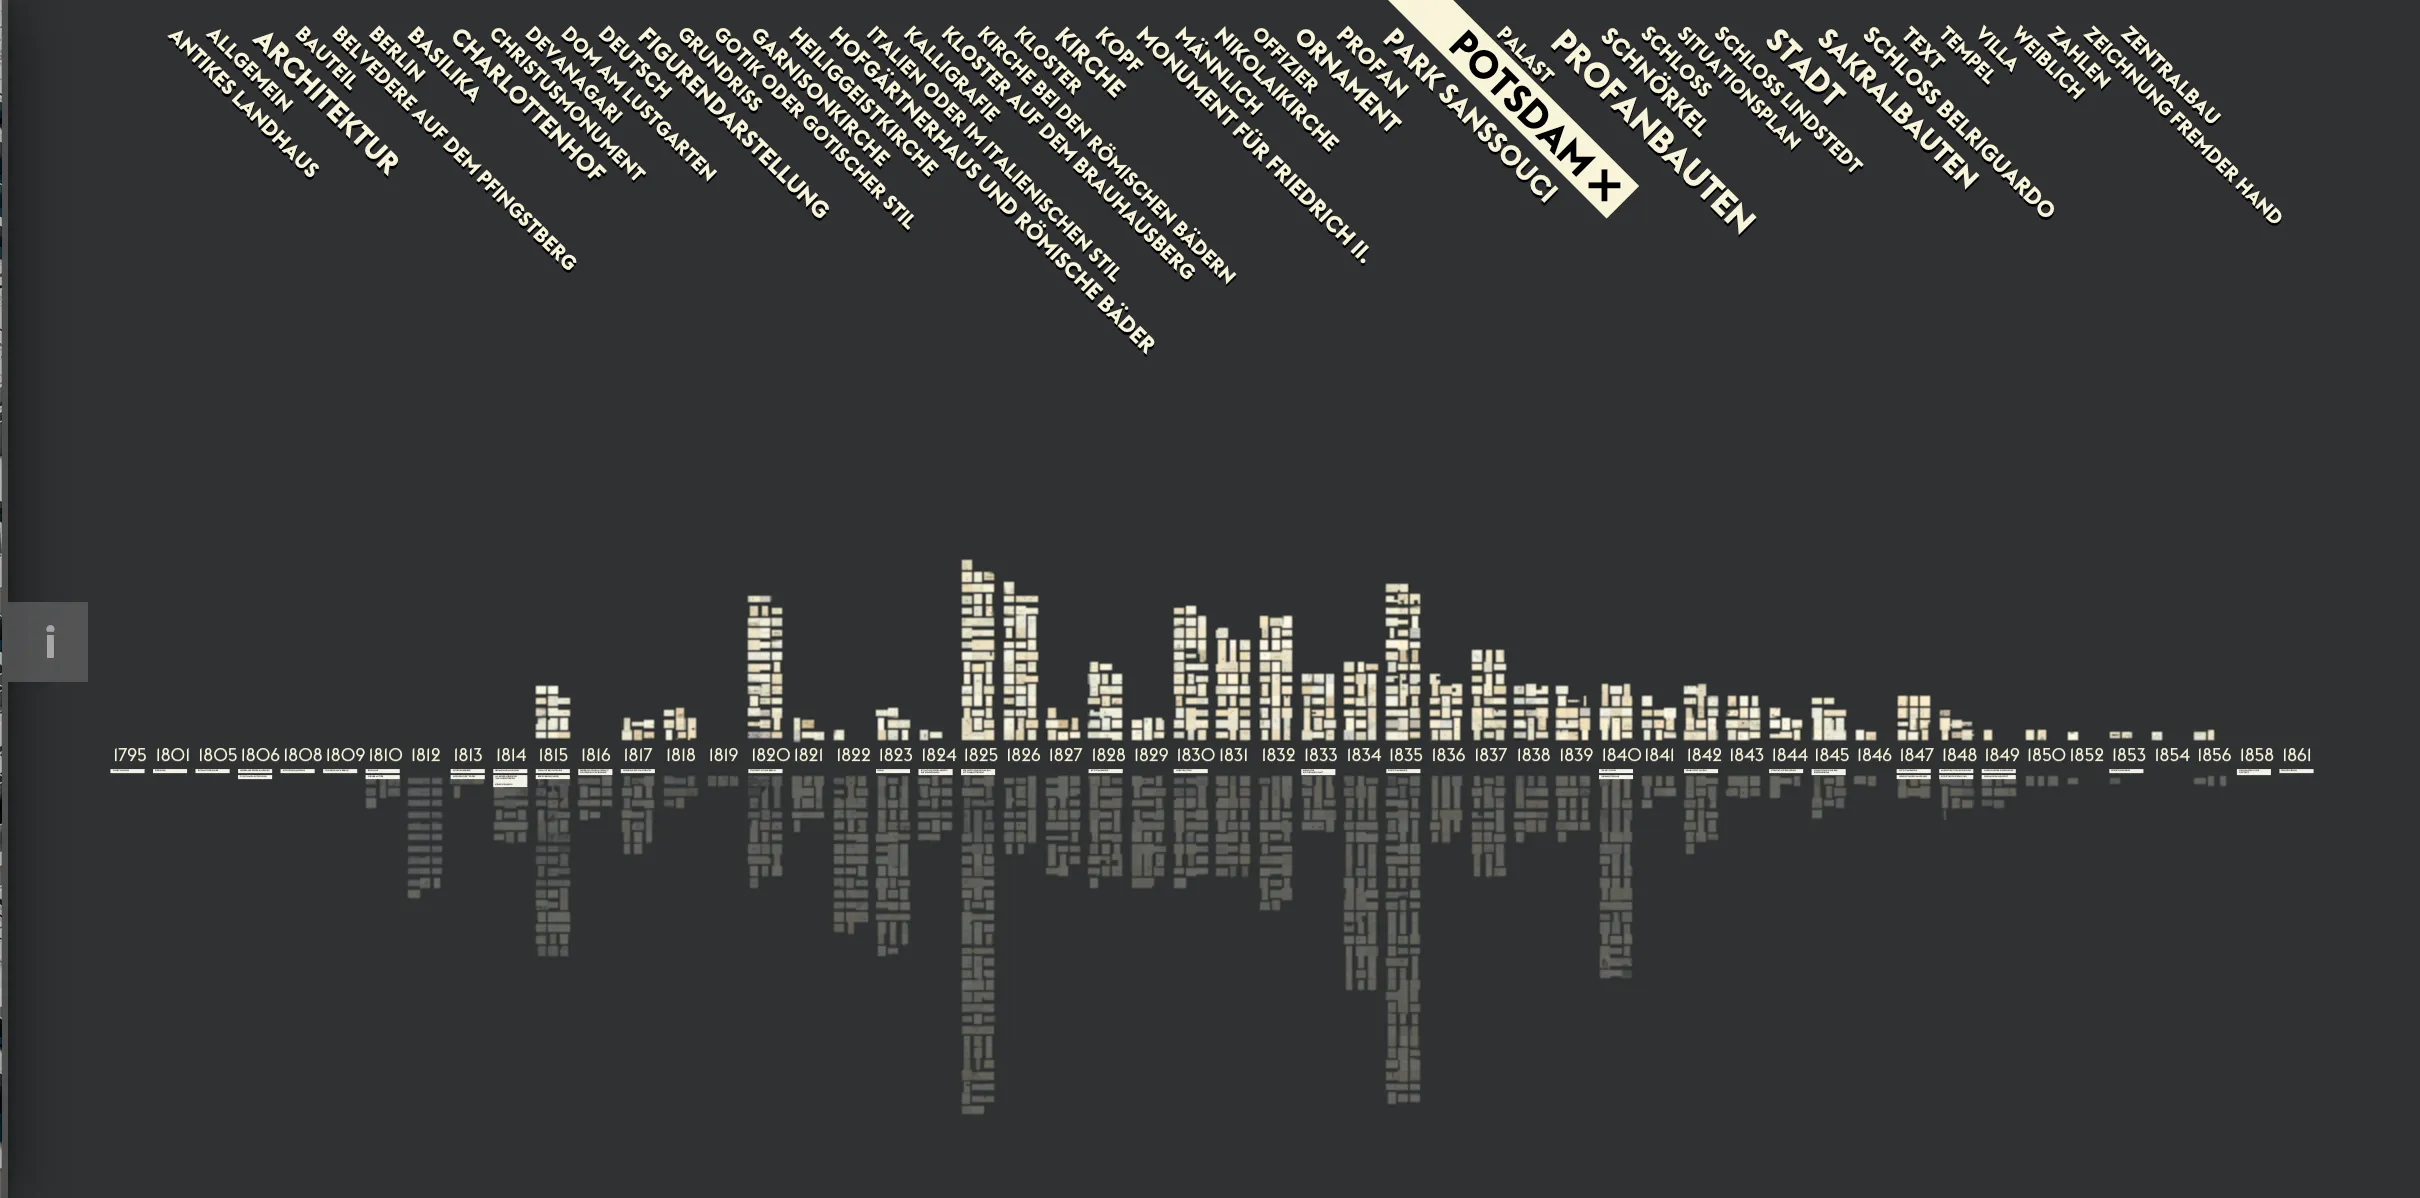
1,492 drawings by Frederick William IV on one zoomable timeline, from the whole collection down to a single pencil stroke.
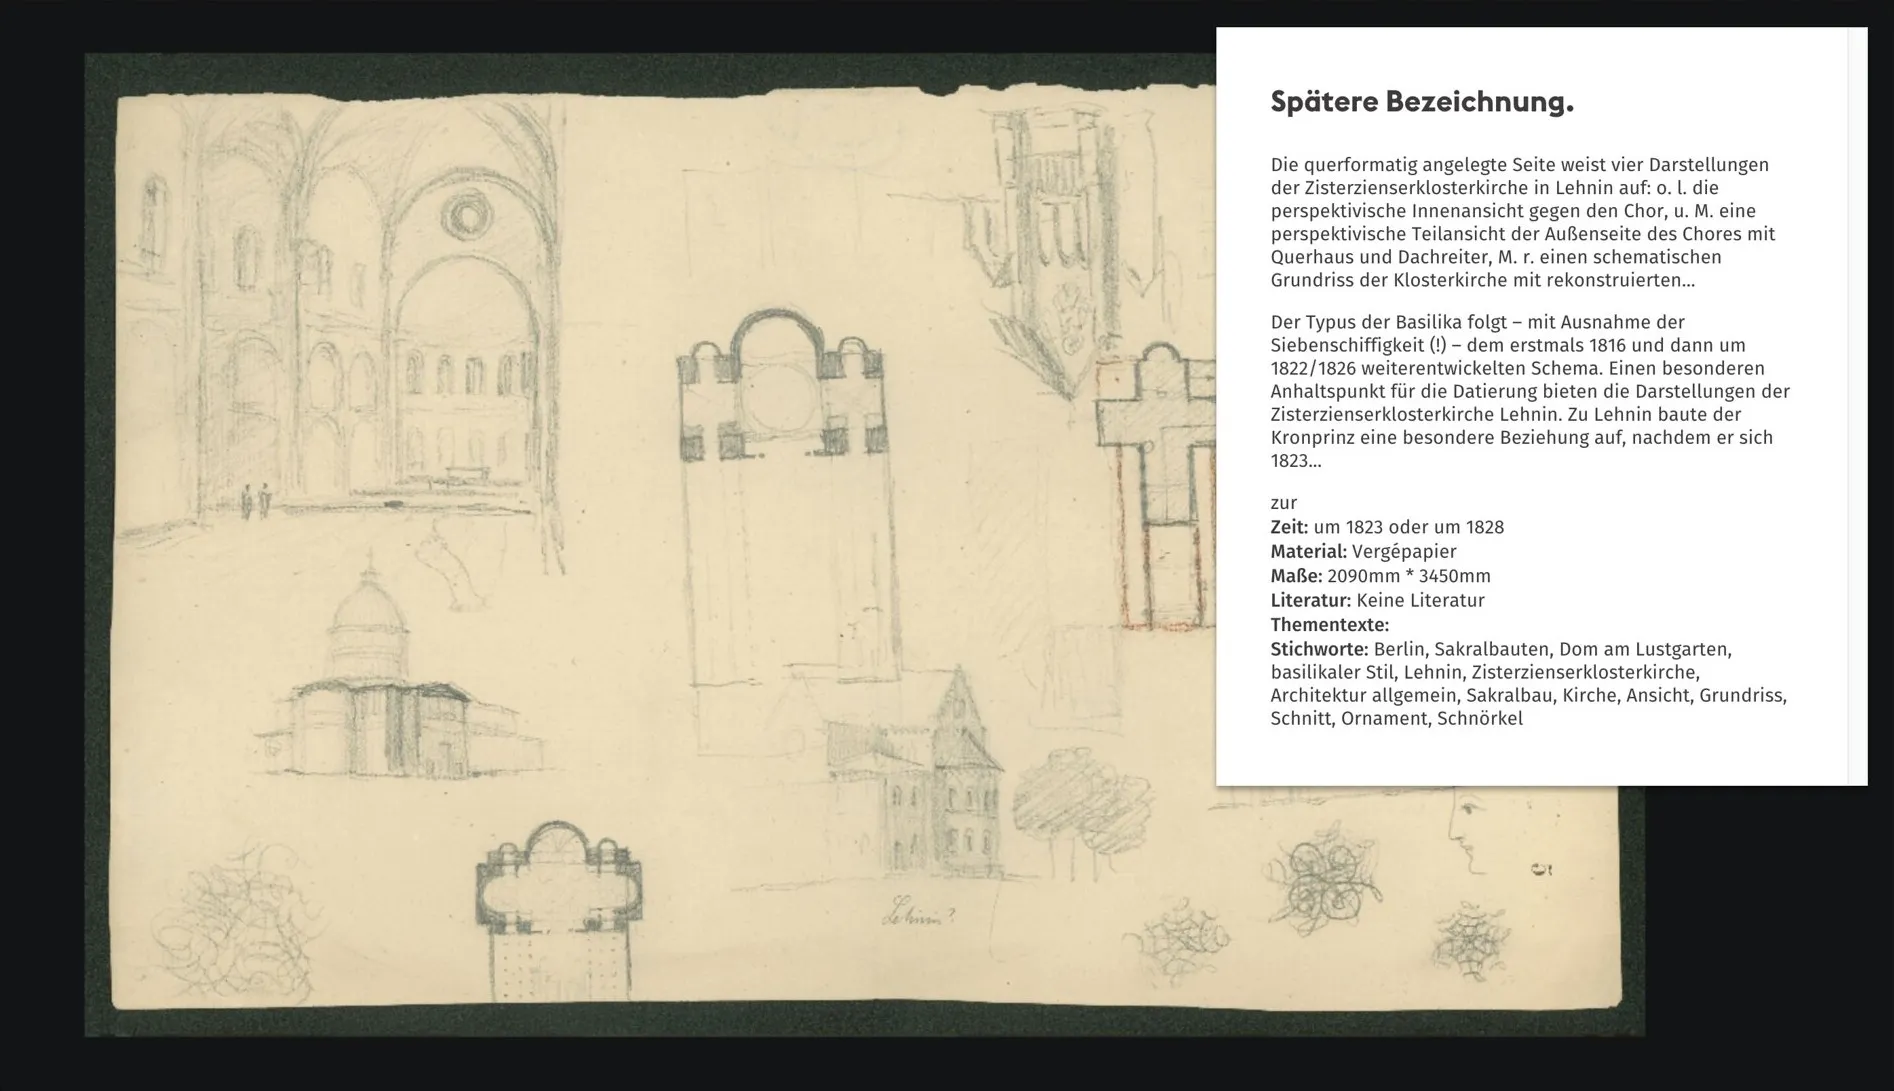
Frederick William IV of Prussia (1795–1861) left behind more than 7,500 sheets of drawings: witnesses to historical events like wars and revolutions, to literary influences, to the planning eye of a king full of architectural visions and dreamy drafts, and to a personal obsession with the devil. Past Visions makes the 1,492 sheets cataloged at the time explorable as one continuous visual field.
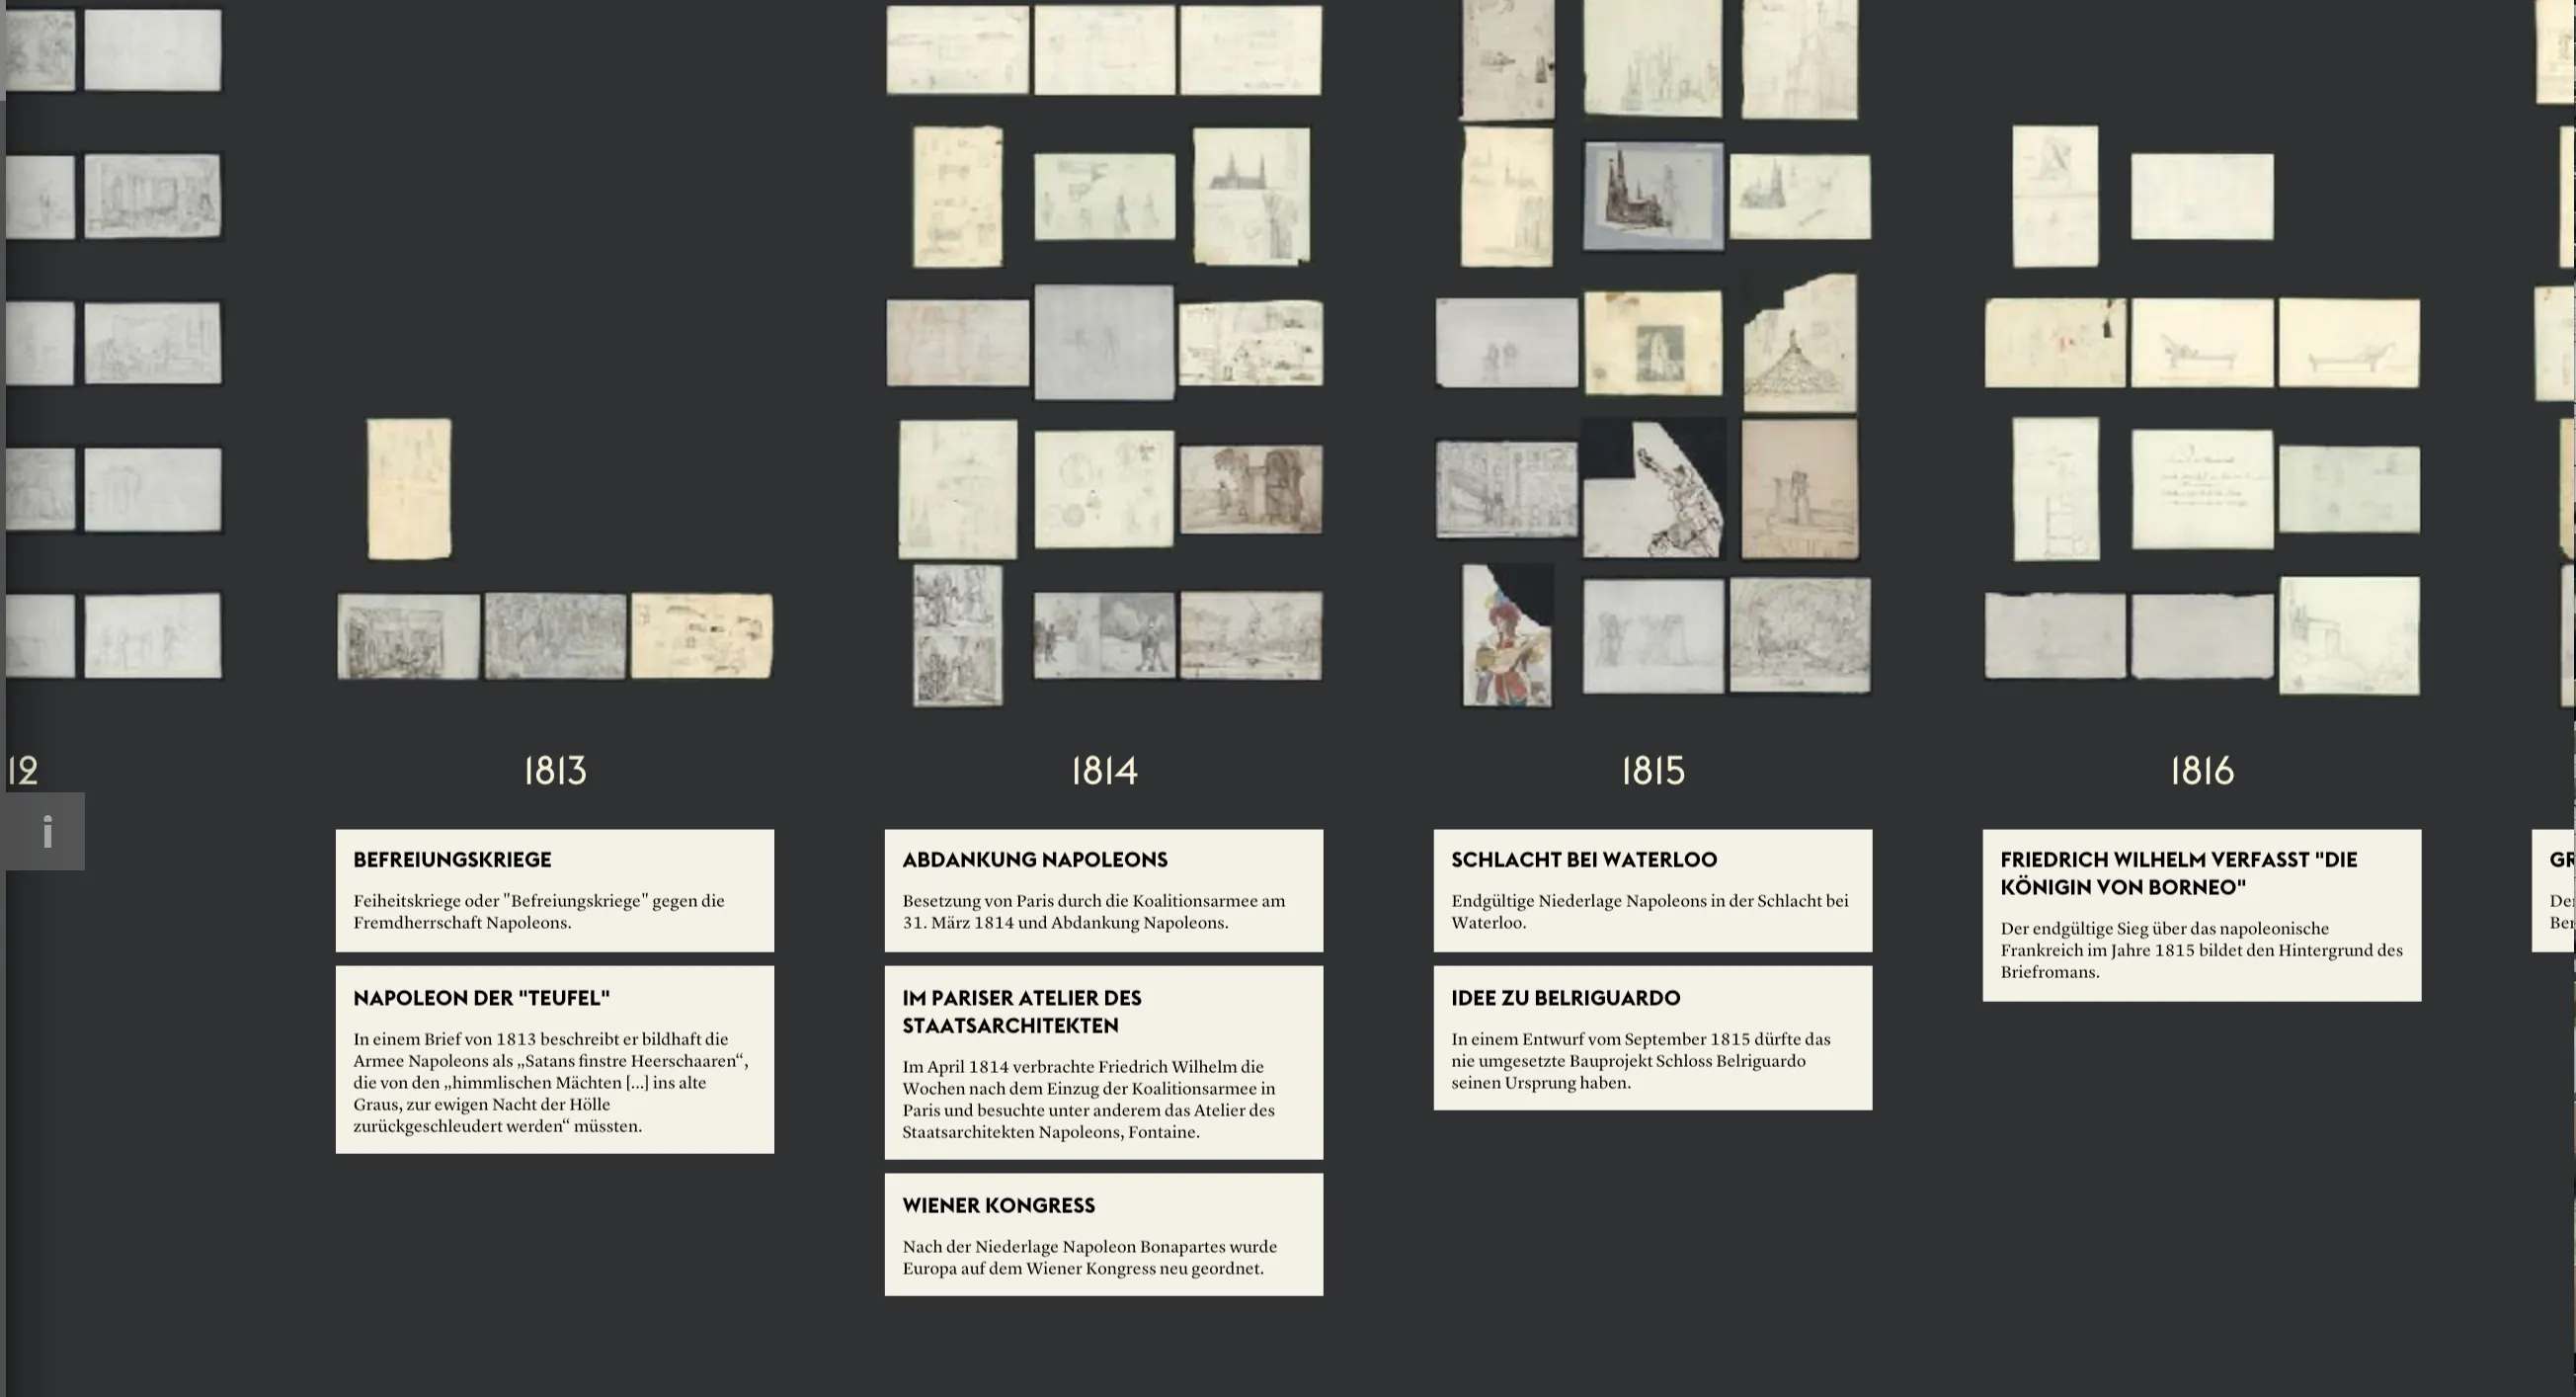
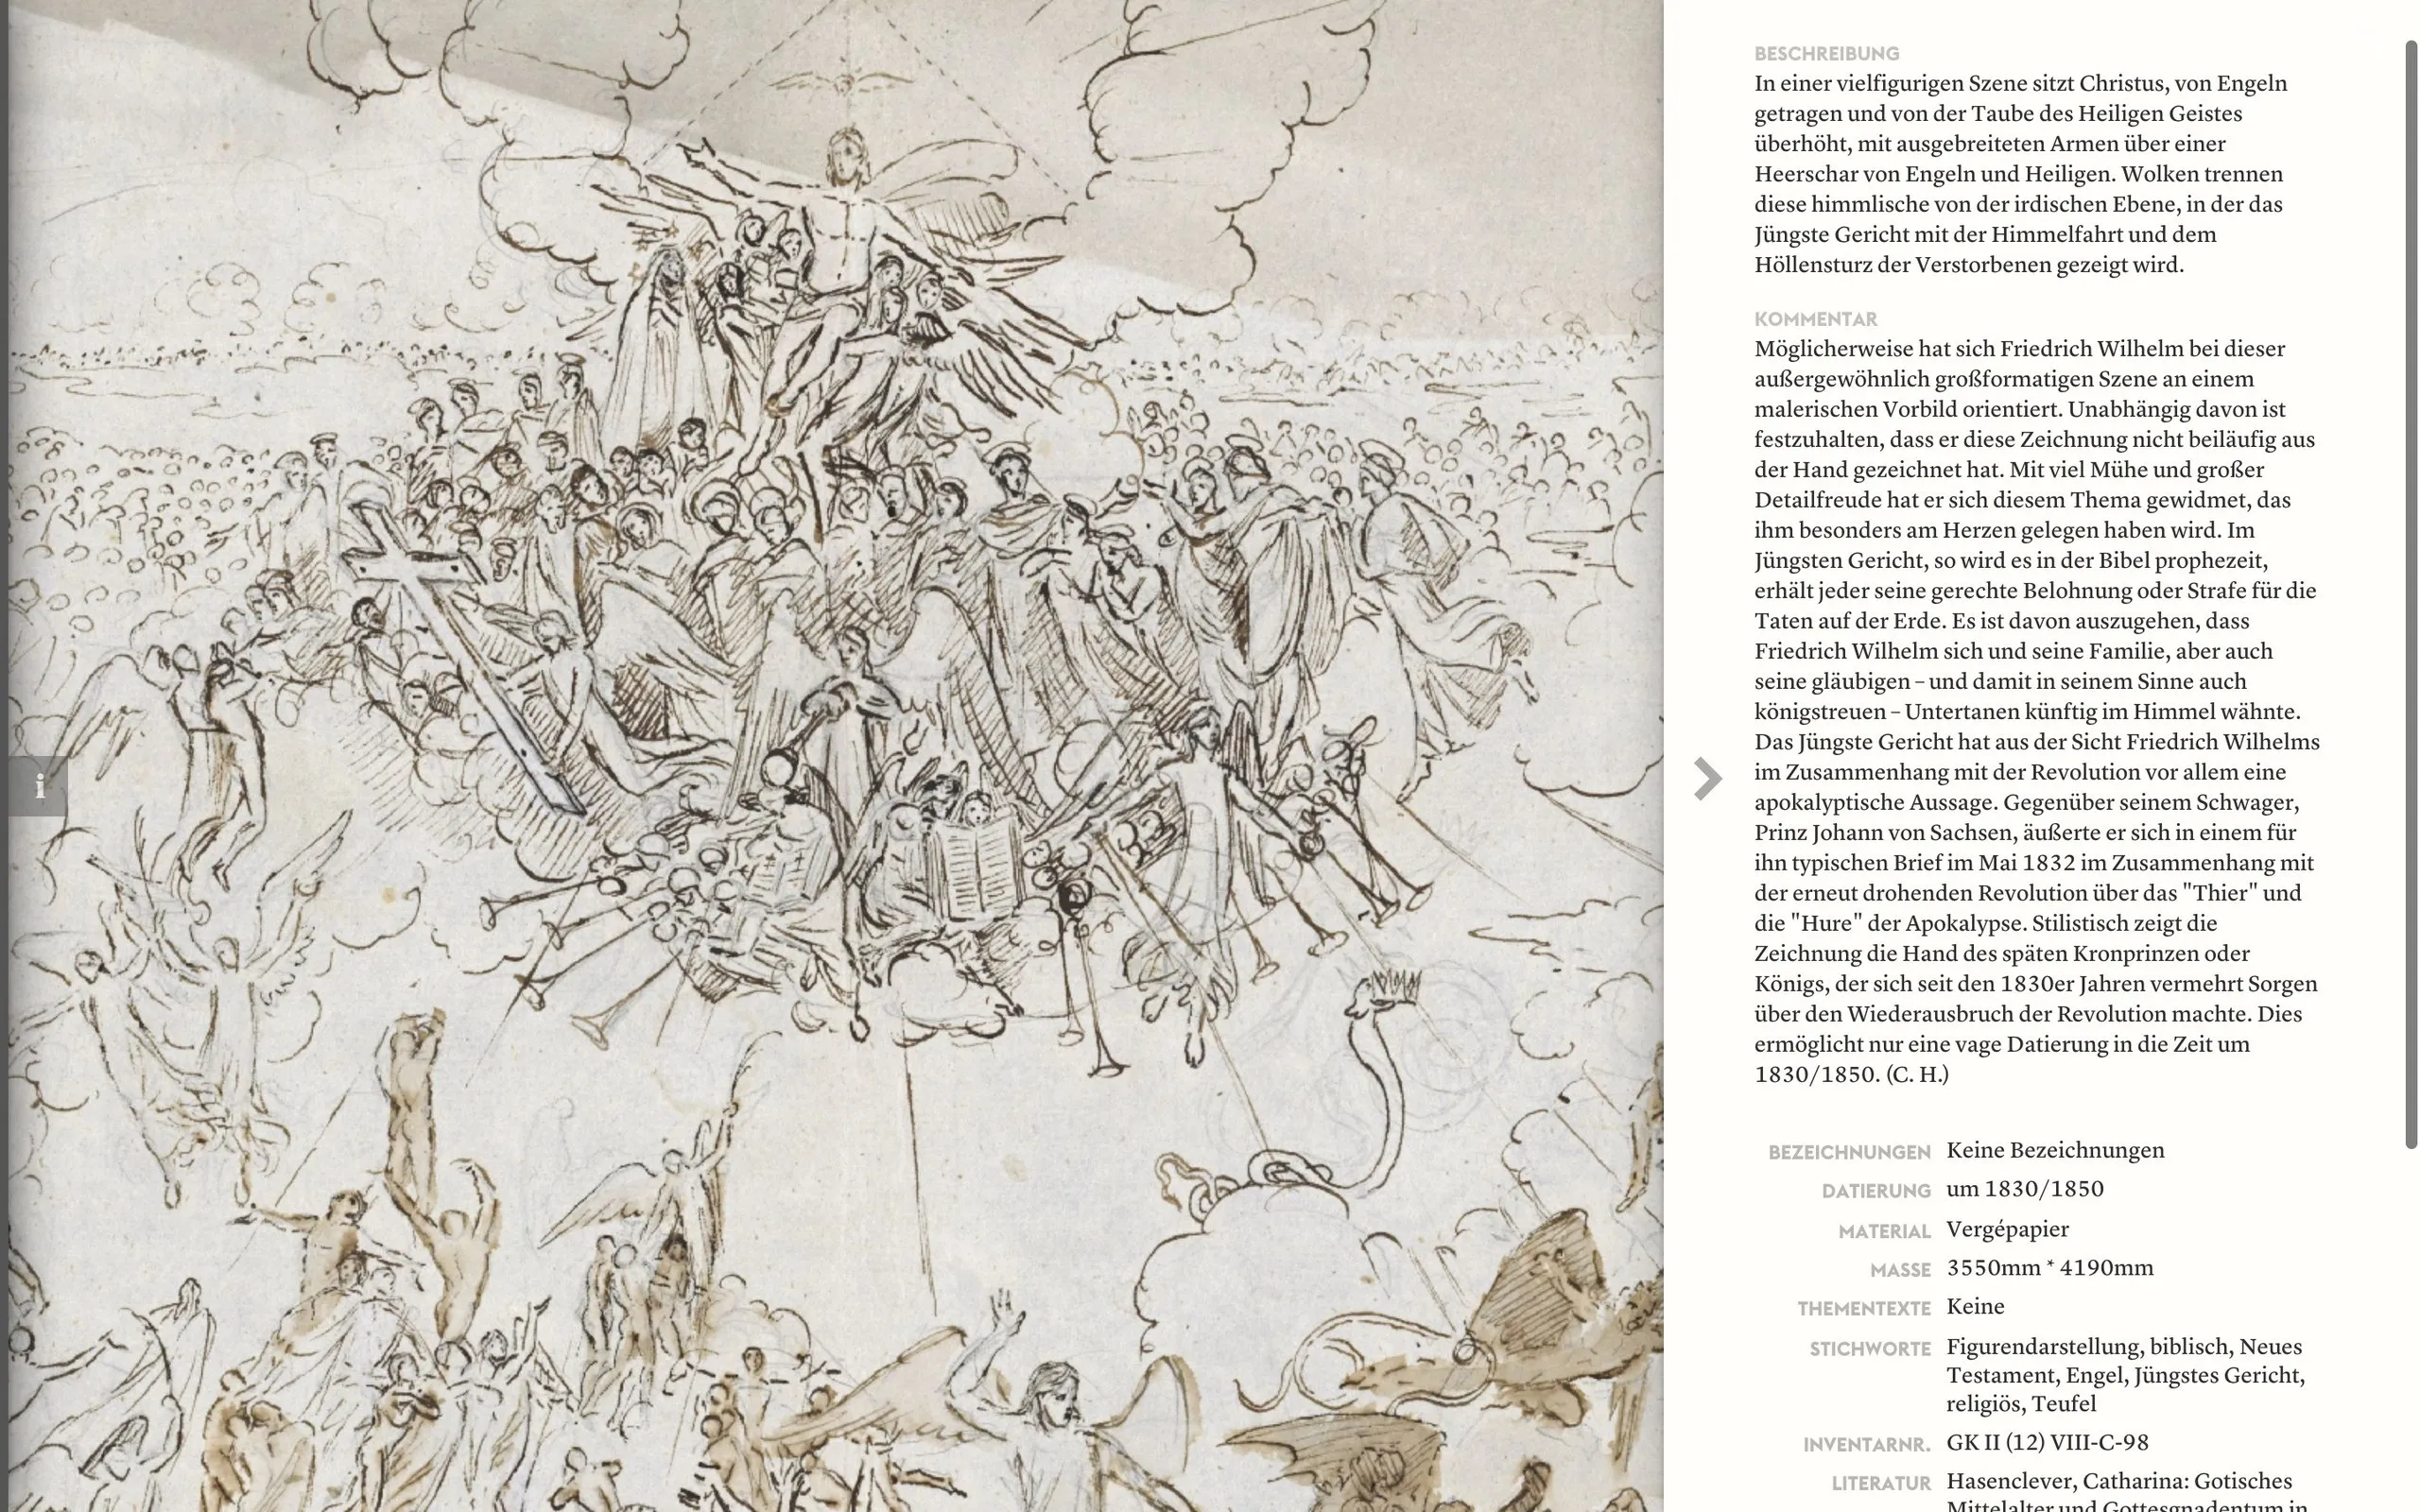
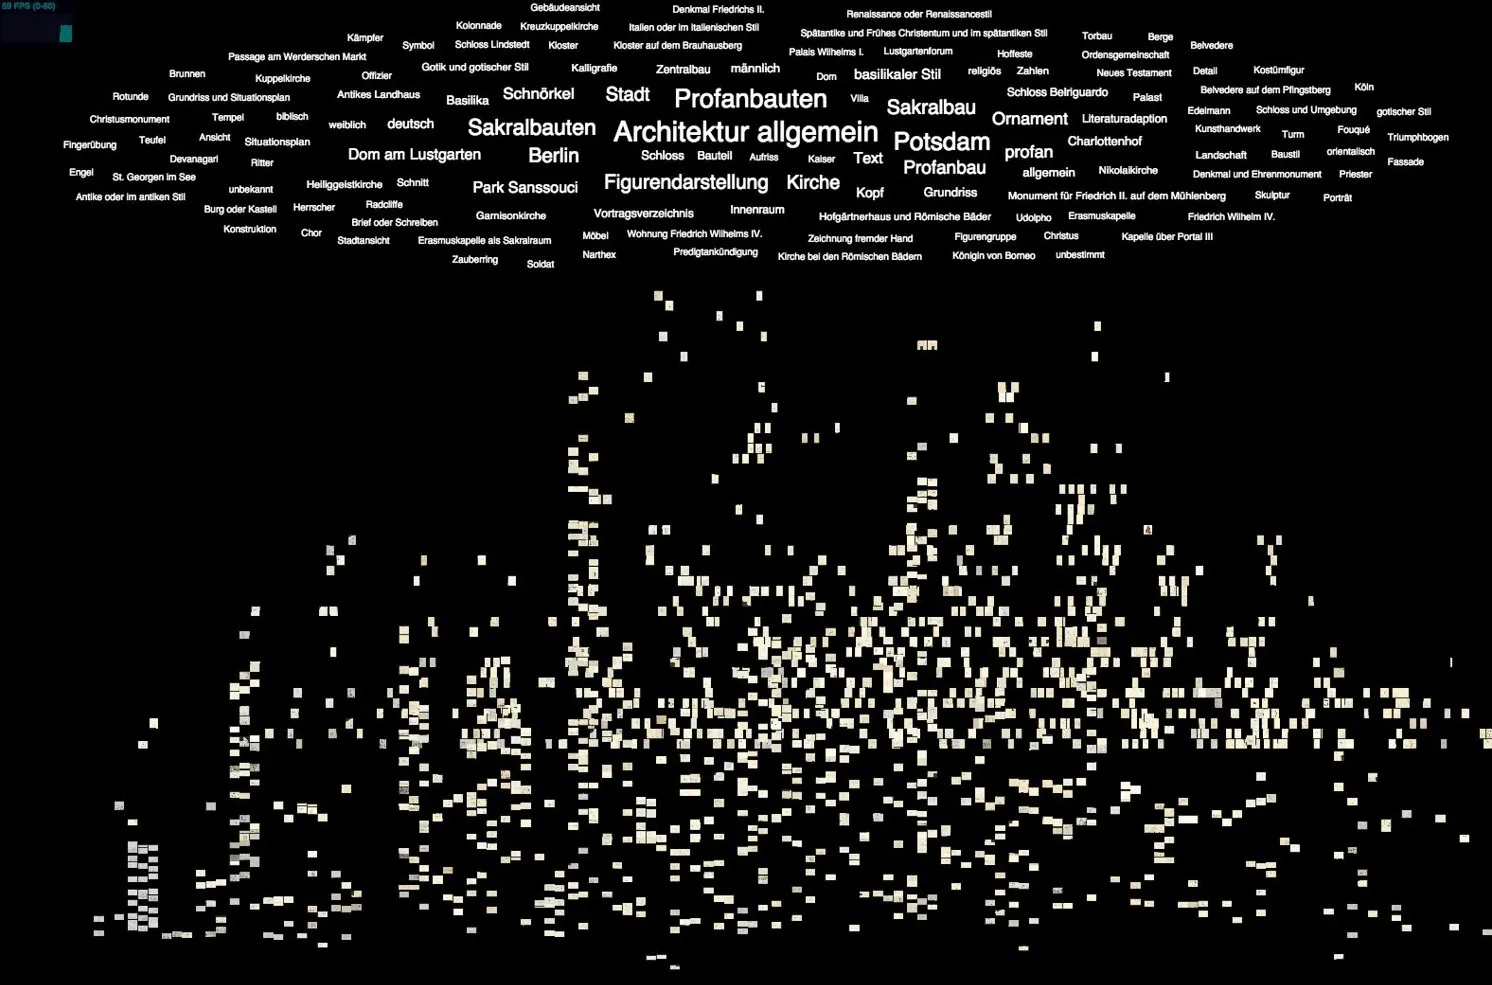
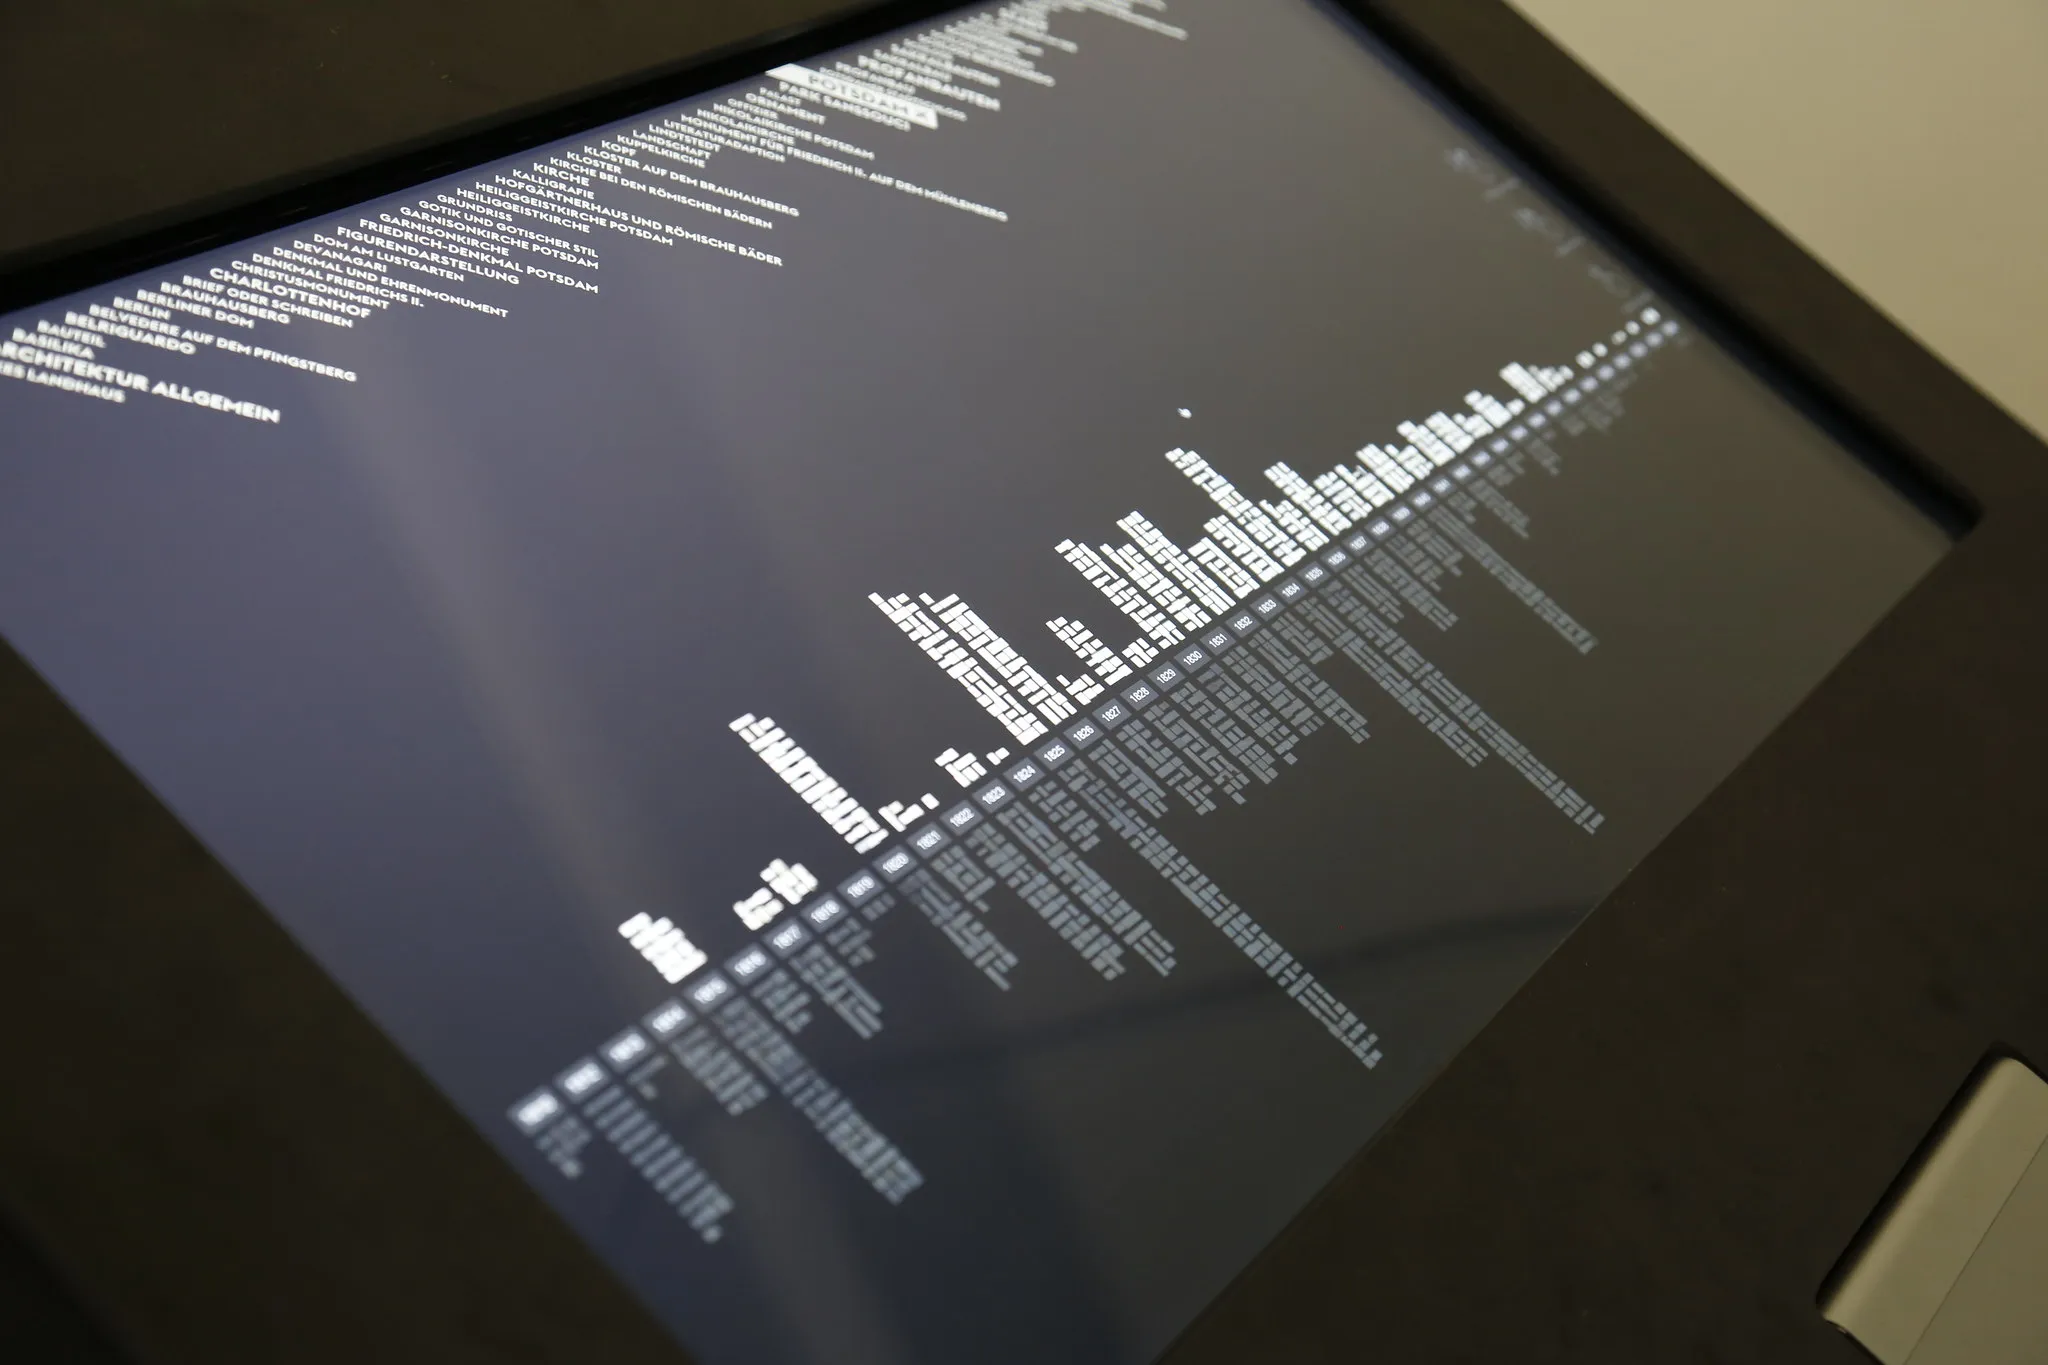
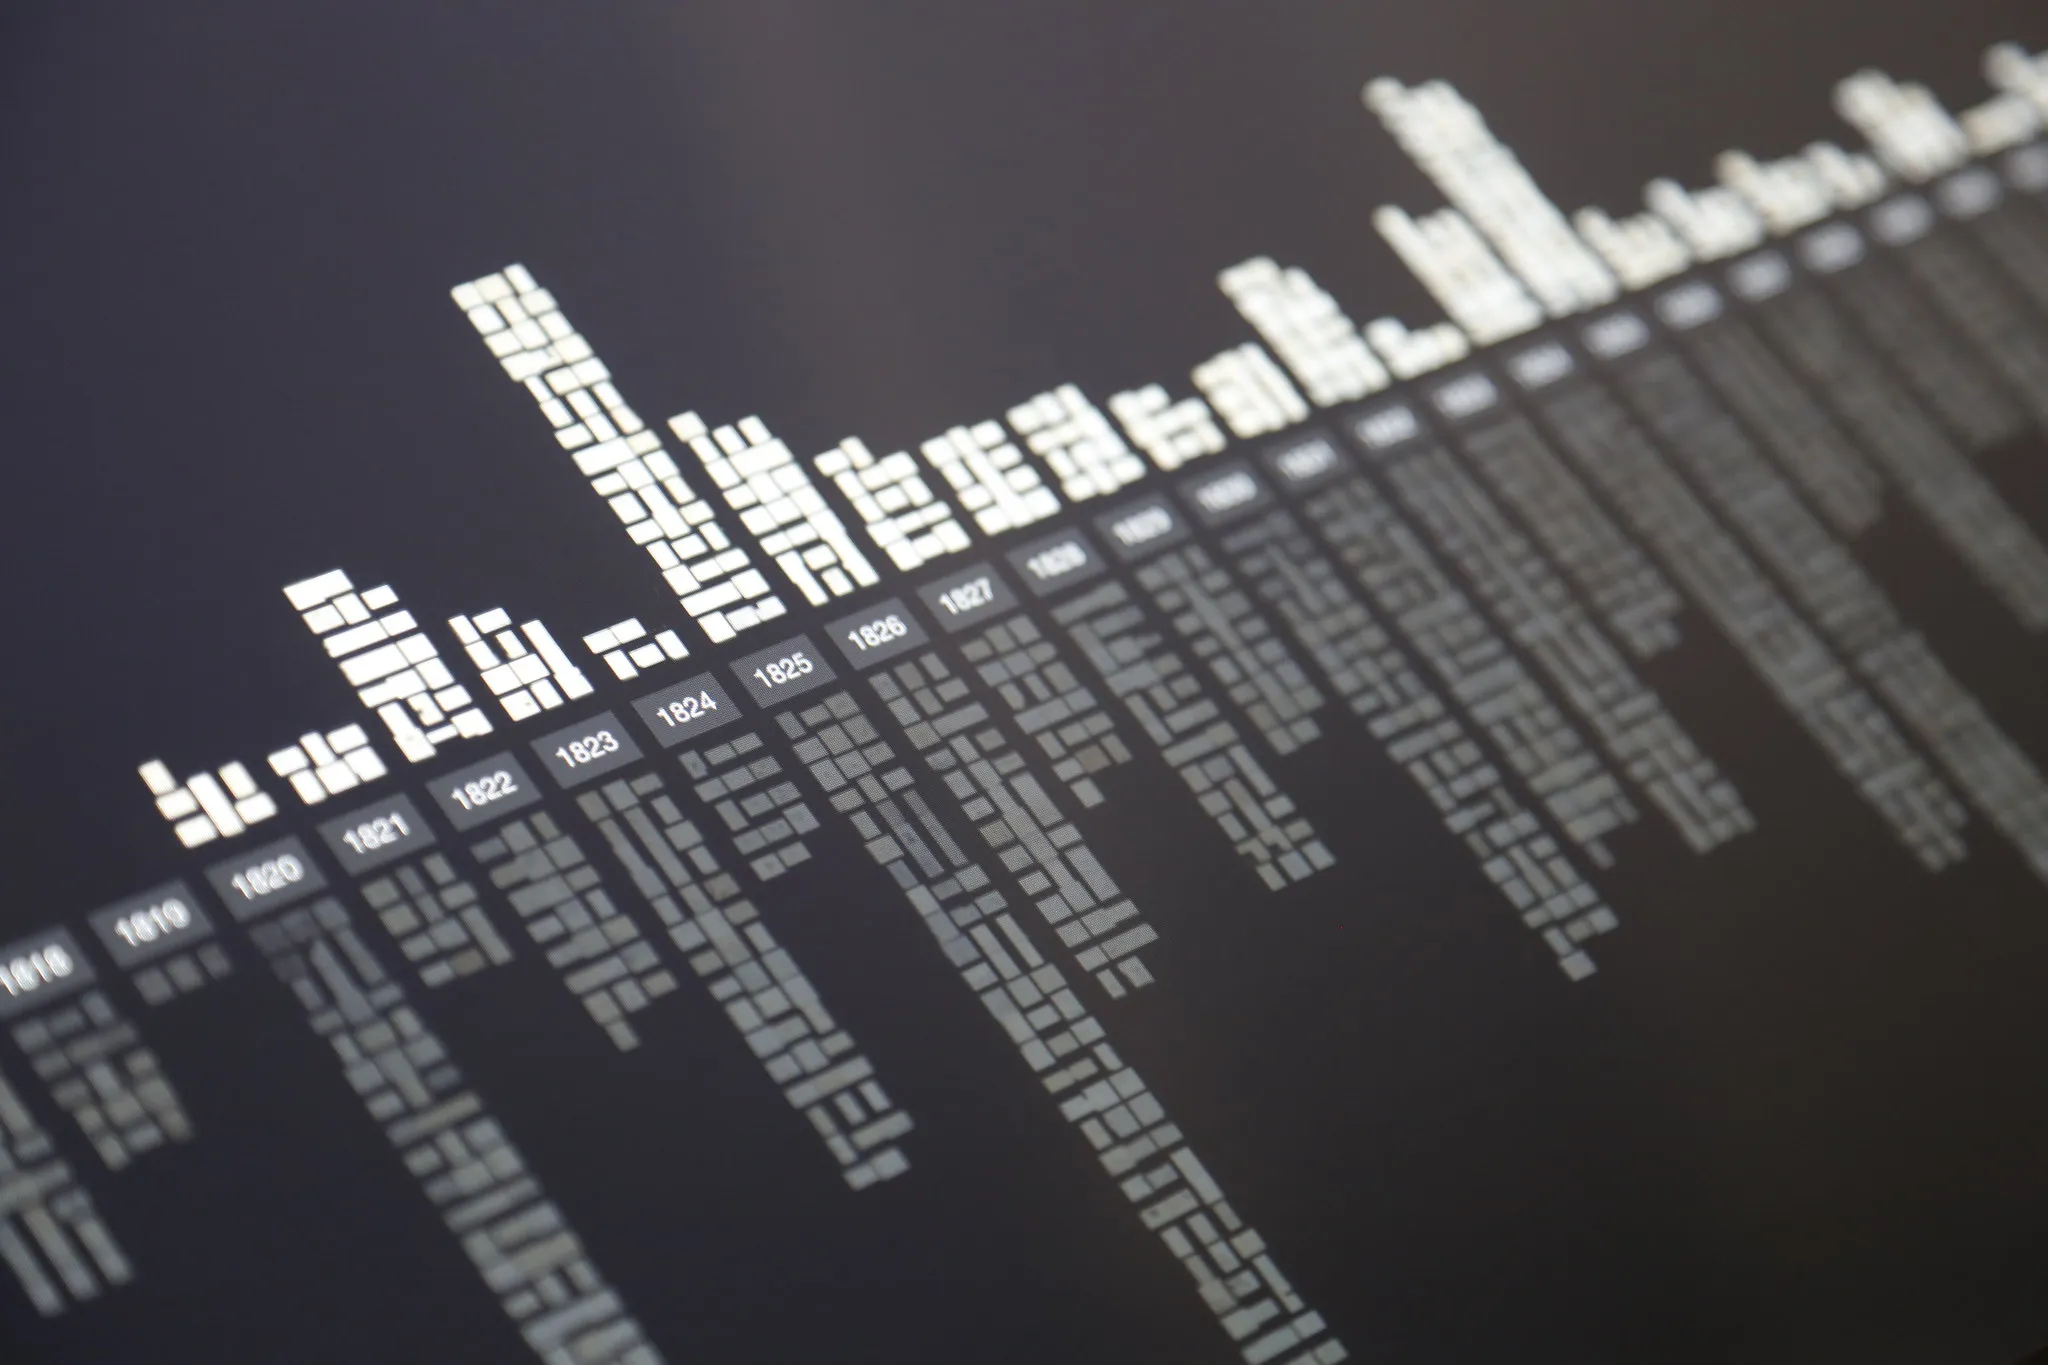
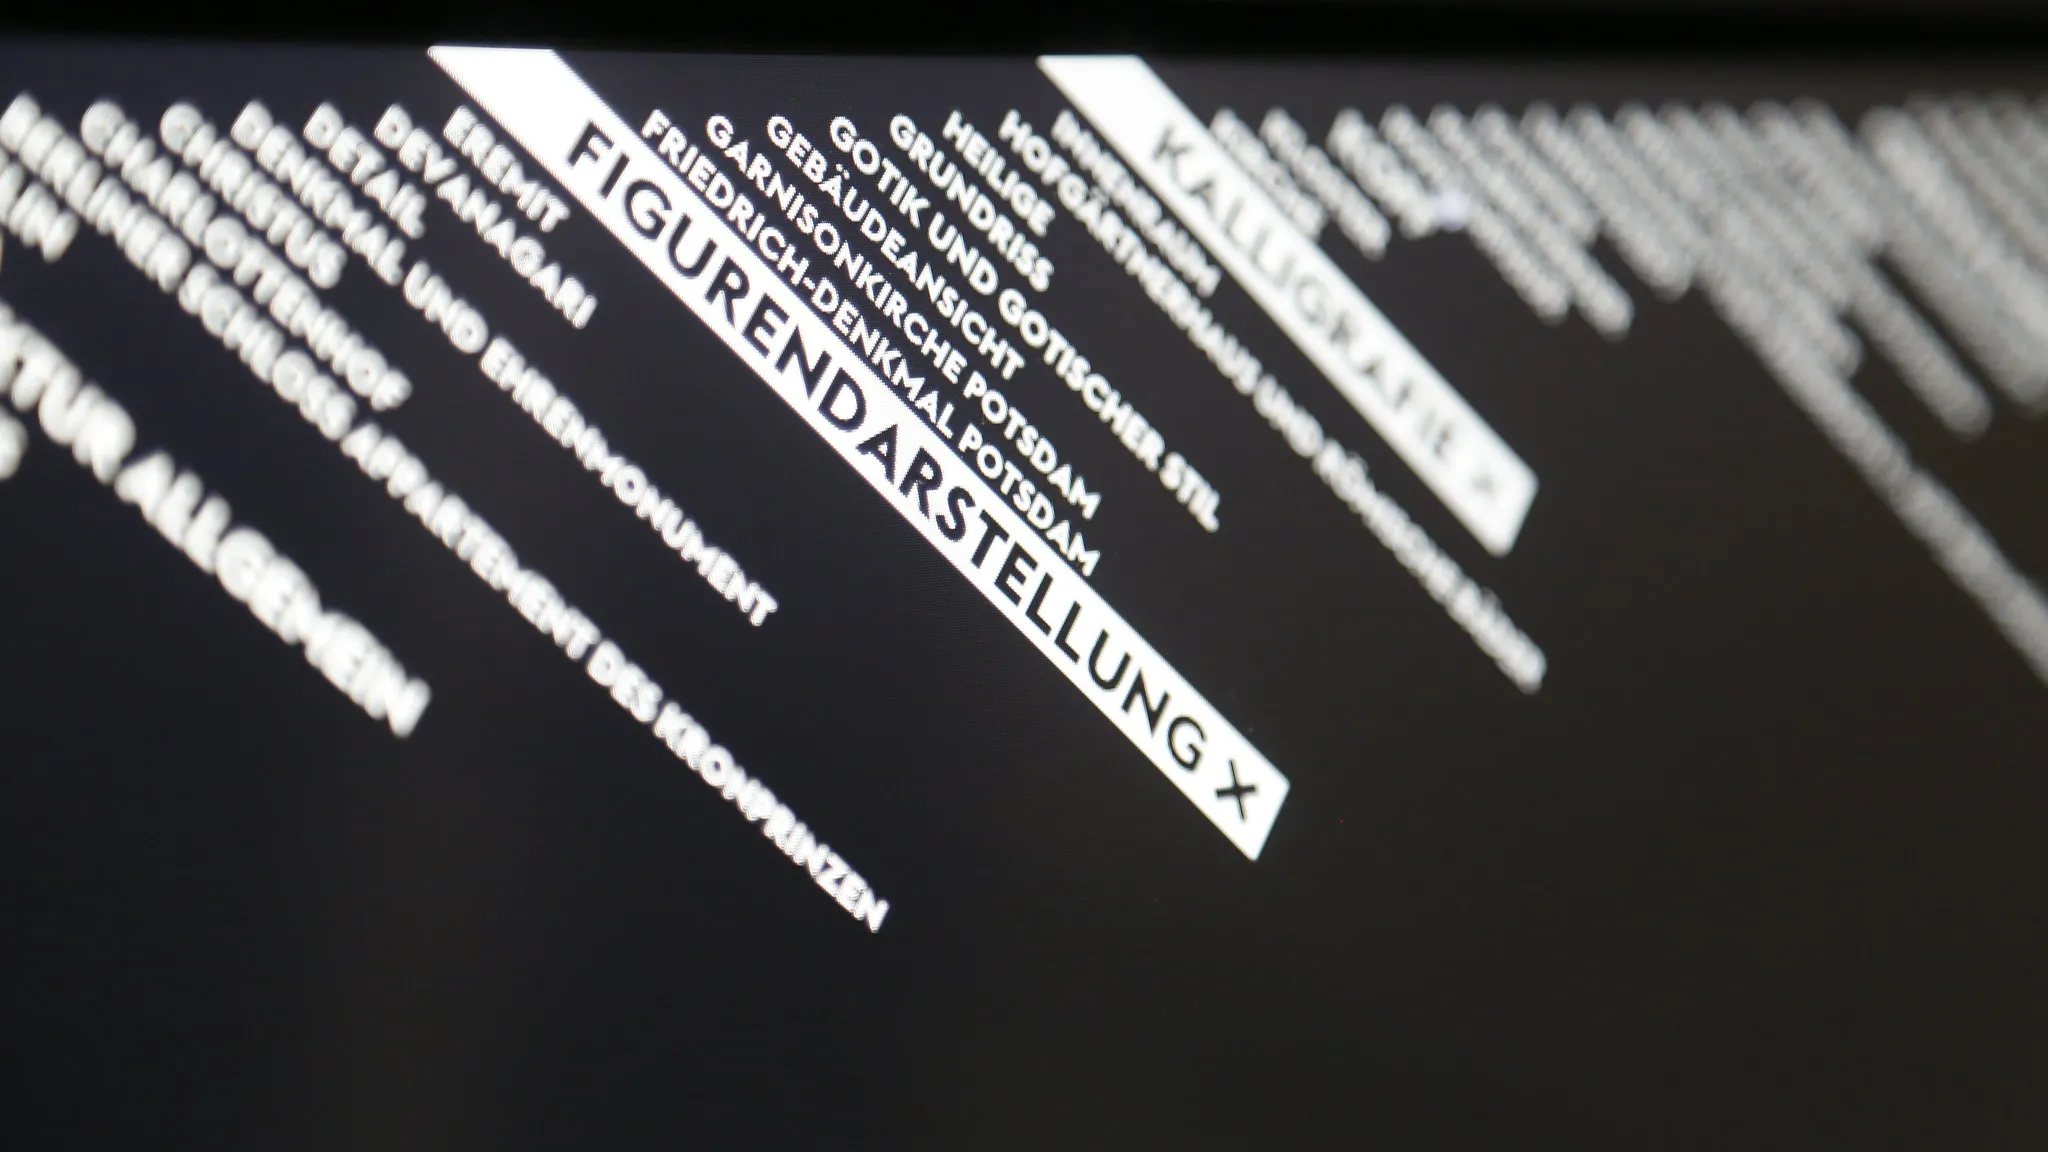
The interface is a zoomable user interface in the browser: all 1,492 sheets arranged along a semantic timeline, filterable by themes, and zoomable from the full collection down to the texture of a single pencil stroke in high resolution. The project was part of the research initiative »Visualizing Cultural Collections« (VIKUS) at FH Potsdam, investigating the potential of visual exploration for digitized cultural heritage.
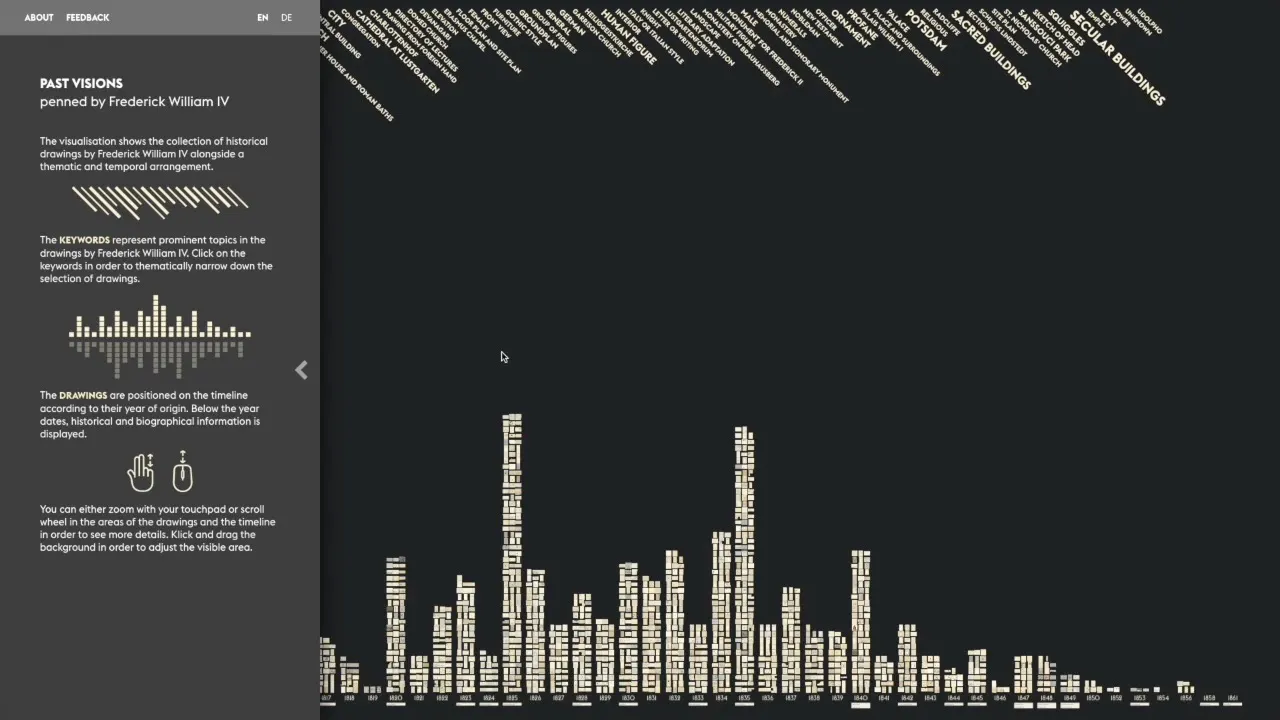
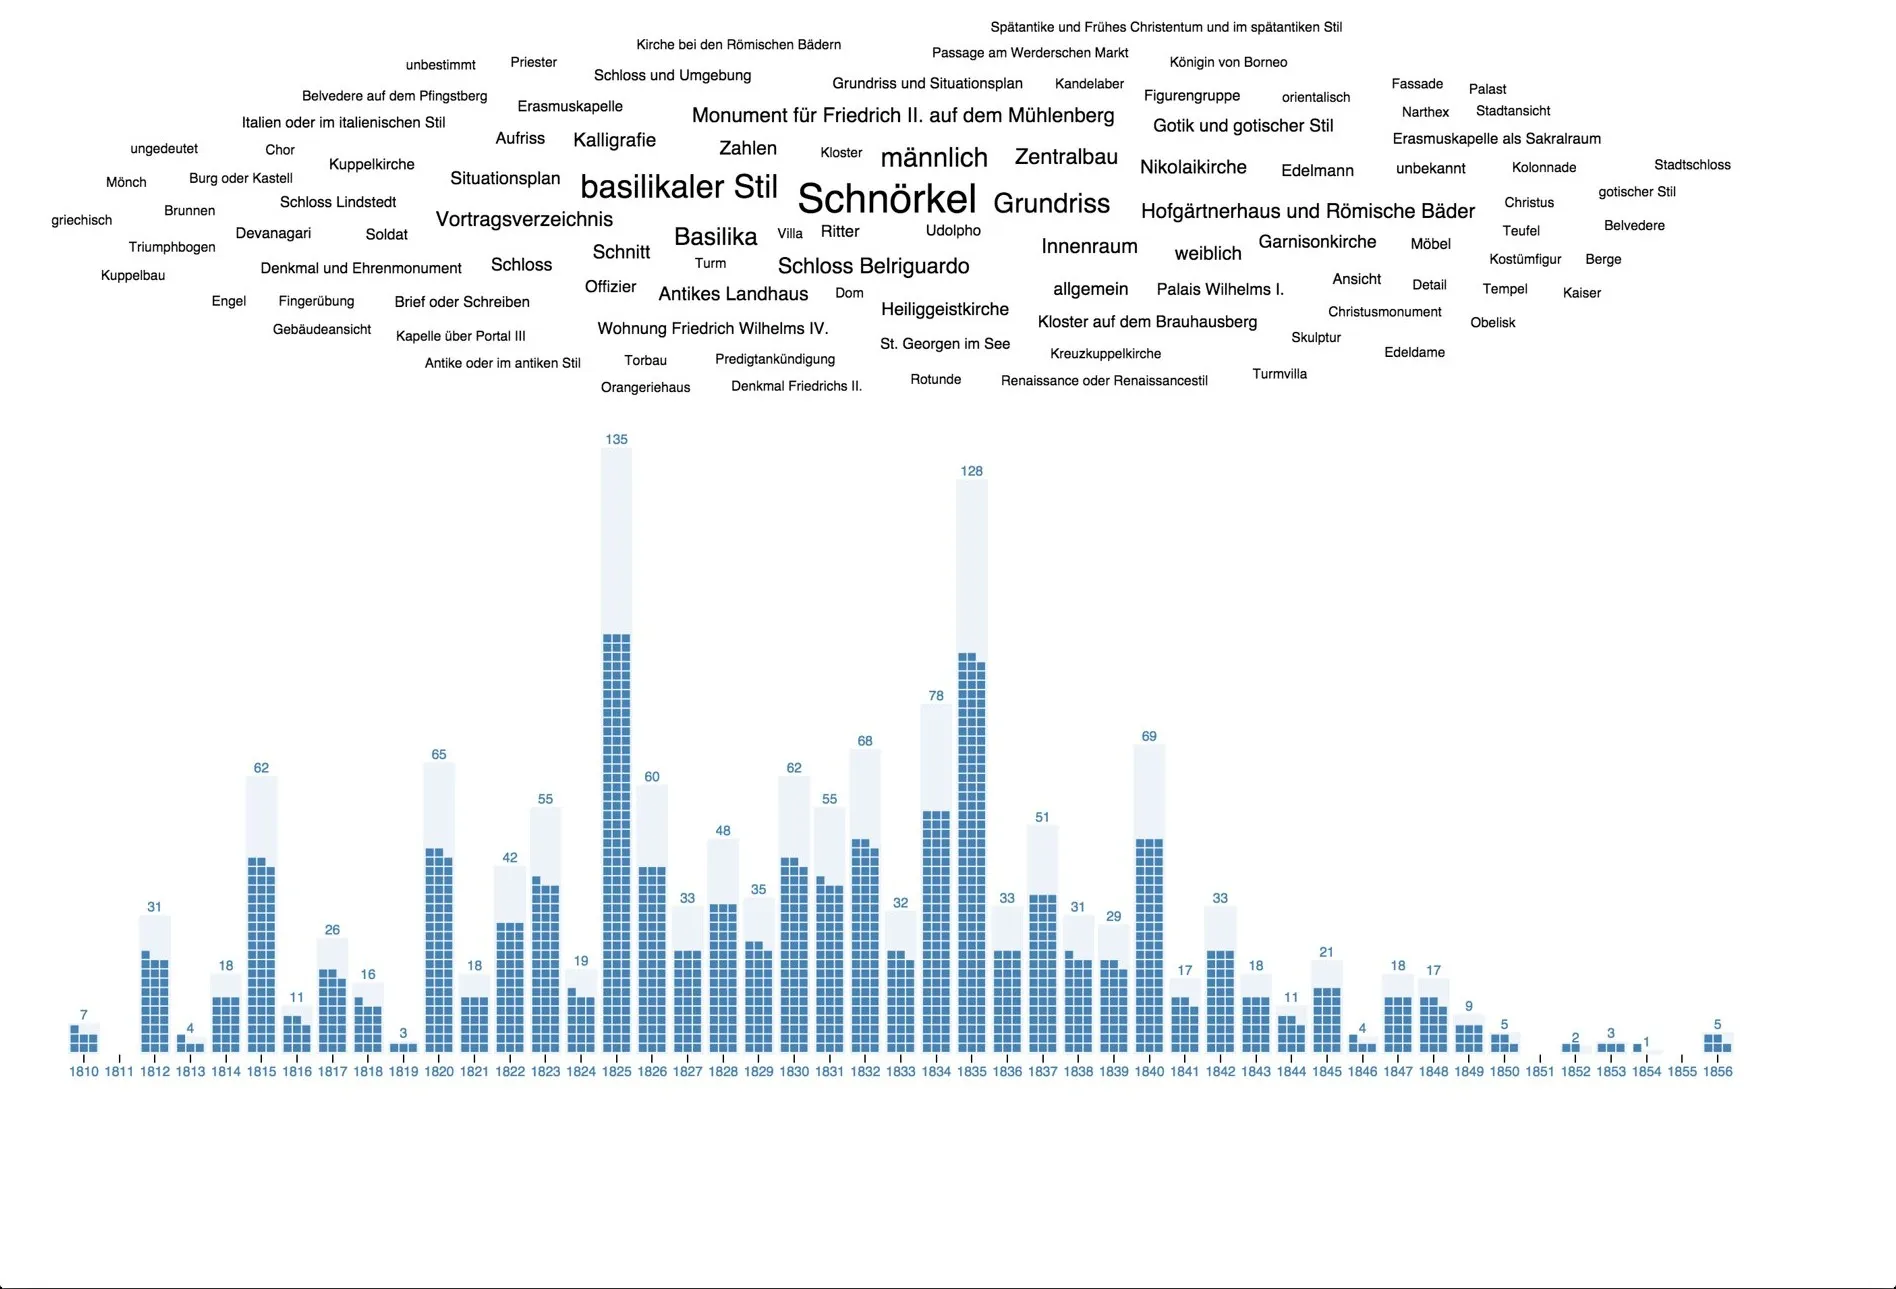
Making that feel effortless was the hard part: handling 1,500 high-resolution images at a fluid 60 fps, keeping look and feel consistent across zoom levels, and shaping a timeline that reads at every scale took countless iterations; some of the process survives in screenshots. An early prototype was already on show as “Past Visions of the Future City” at Streams and Traces in Berlin in 2015, alongside cf. city flows; the system (code) later generalized into the open-source VIKUS Viewer and remains an experiment in pushing what the web (and information access in general) can feel like. The original 2016 interface still runs, and VIKUS Viewer’s FW4 edition now shows 6,905 of the king’s drawings.
Developed together with and for the Urban Complexity Lab (Katrin Glinka, Marian Dörk), in cooperation with the Prussian Palaces and Gardens Foundation (SPSG). Dedicated to Jef Raskin, father of all Zooming User Interfaces.
Images
Left and right arrow keys flip through the pile, Enter enlarges the top image.