Visual Exploration of the Financial Lobby
An explorable map of Germany's financial lobby for Finanzwende — who comments, who testifies, and how they are connected.
When Germany regulates its financial markets, certain voices are always in the room. For the citizen movement Finanzwende, I worked with data journalist Lorenz Matzat on »Visuelle Erkundung der Aktivitäten der Finanzlobby«, an interactive exploration of the financial lobby’s activities, making a complex influence network legible for a general audience. It accompanied Finanzwende’s study »Ungleiches Terrain«, published on December 9, 2020.
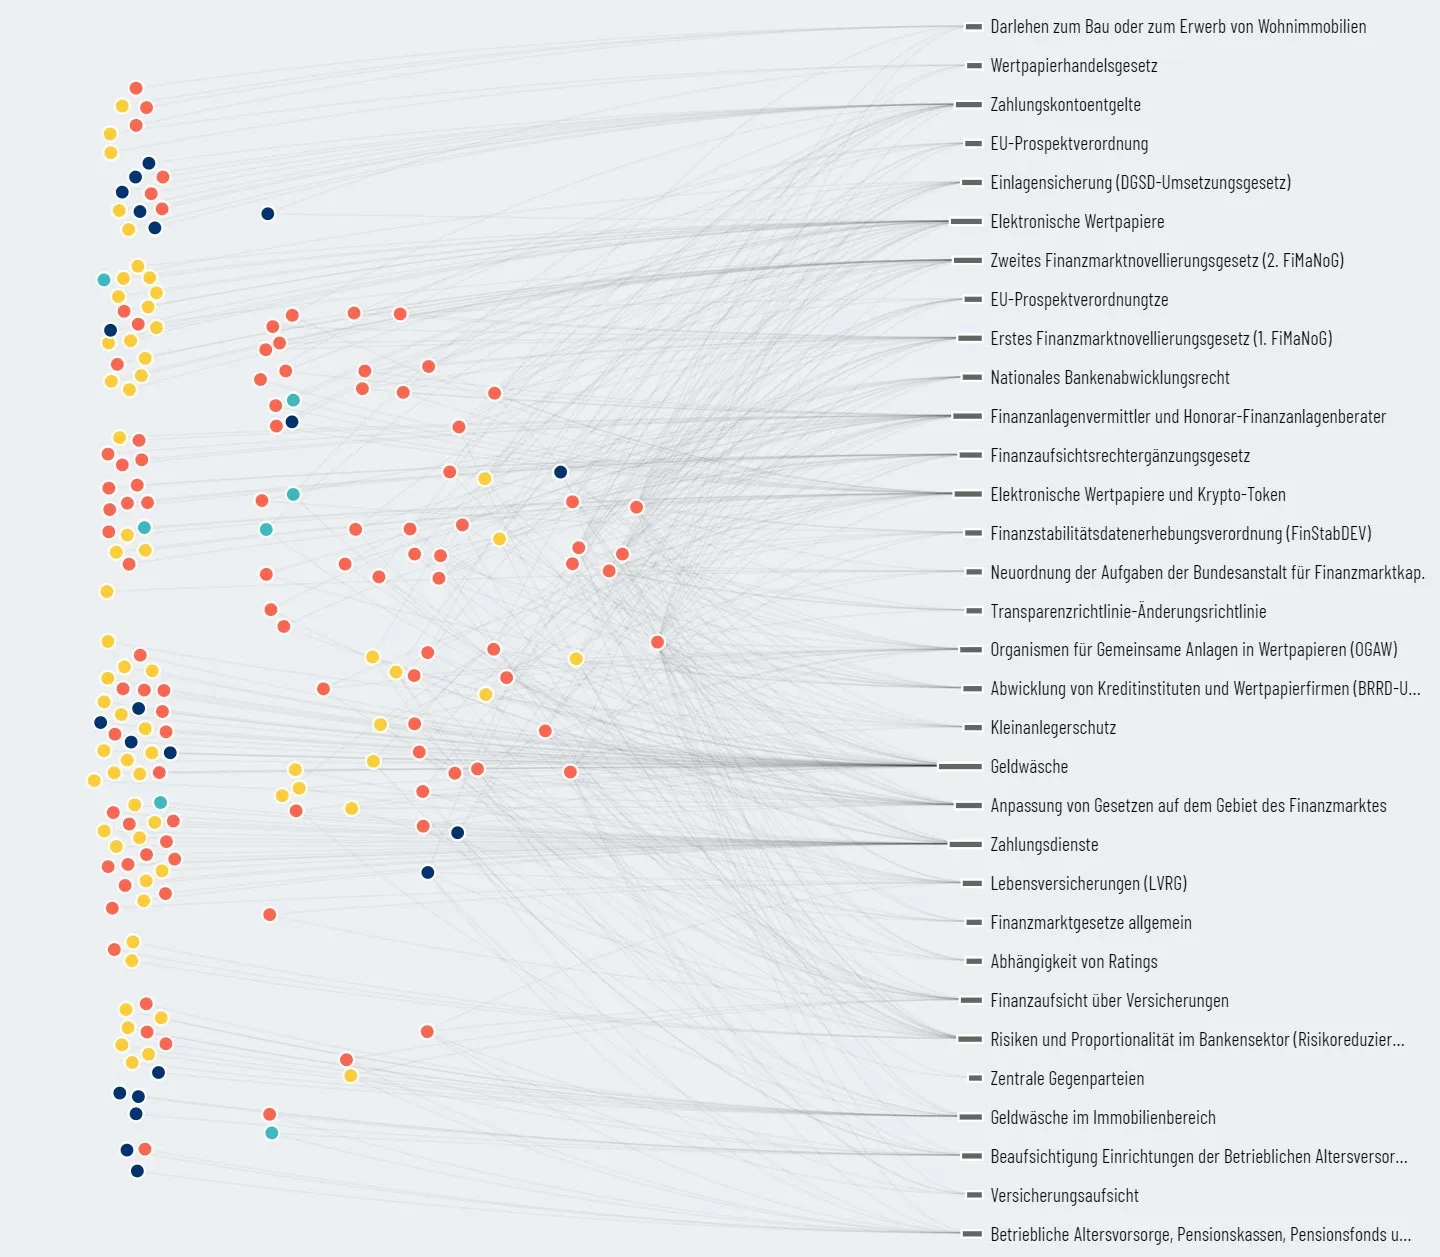
The data covers 34 meetings of the Bundestag Finance Committee and 33 ministerial draft bills related to the financial market between 2014 and 2020: which associations and companies submitted comments and statements, and how they are connected to one another. Finanzwende reviewed more than 500 comments on draft bills and more than 500 invitations to committee meetings.
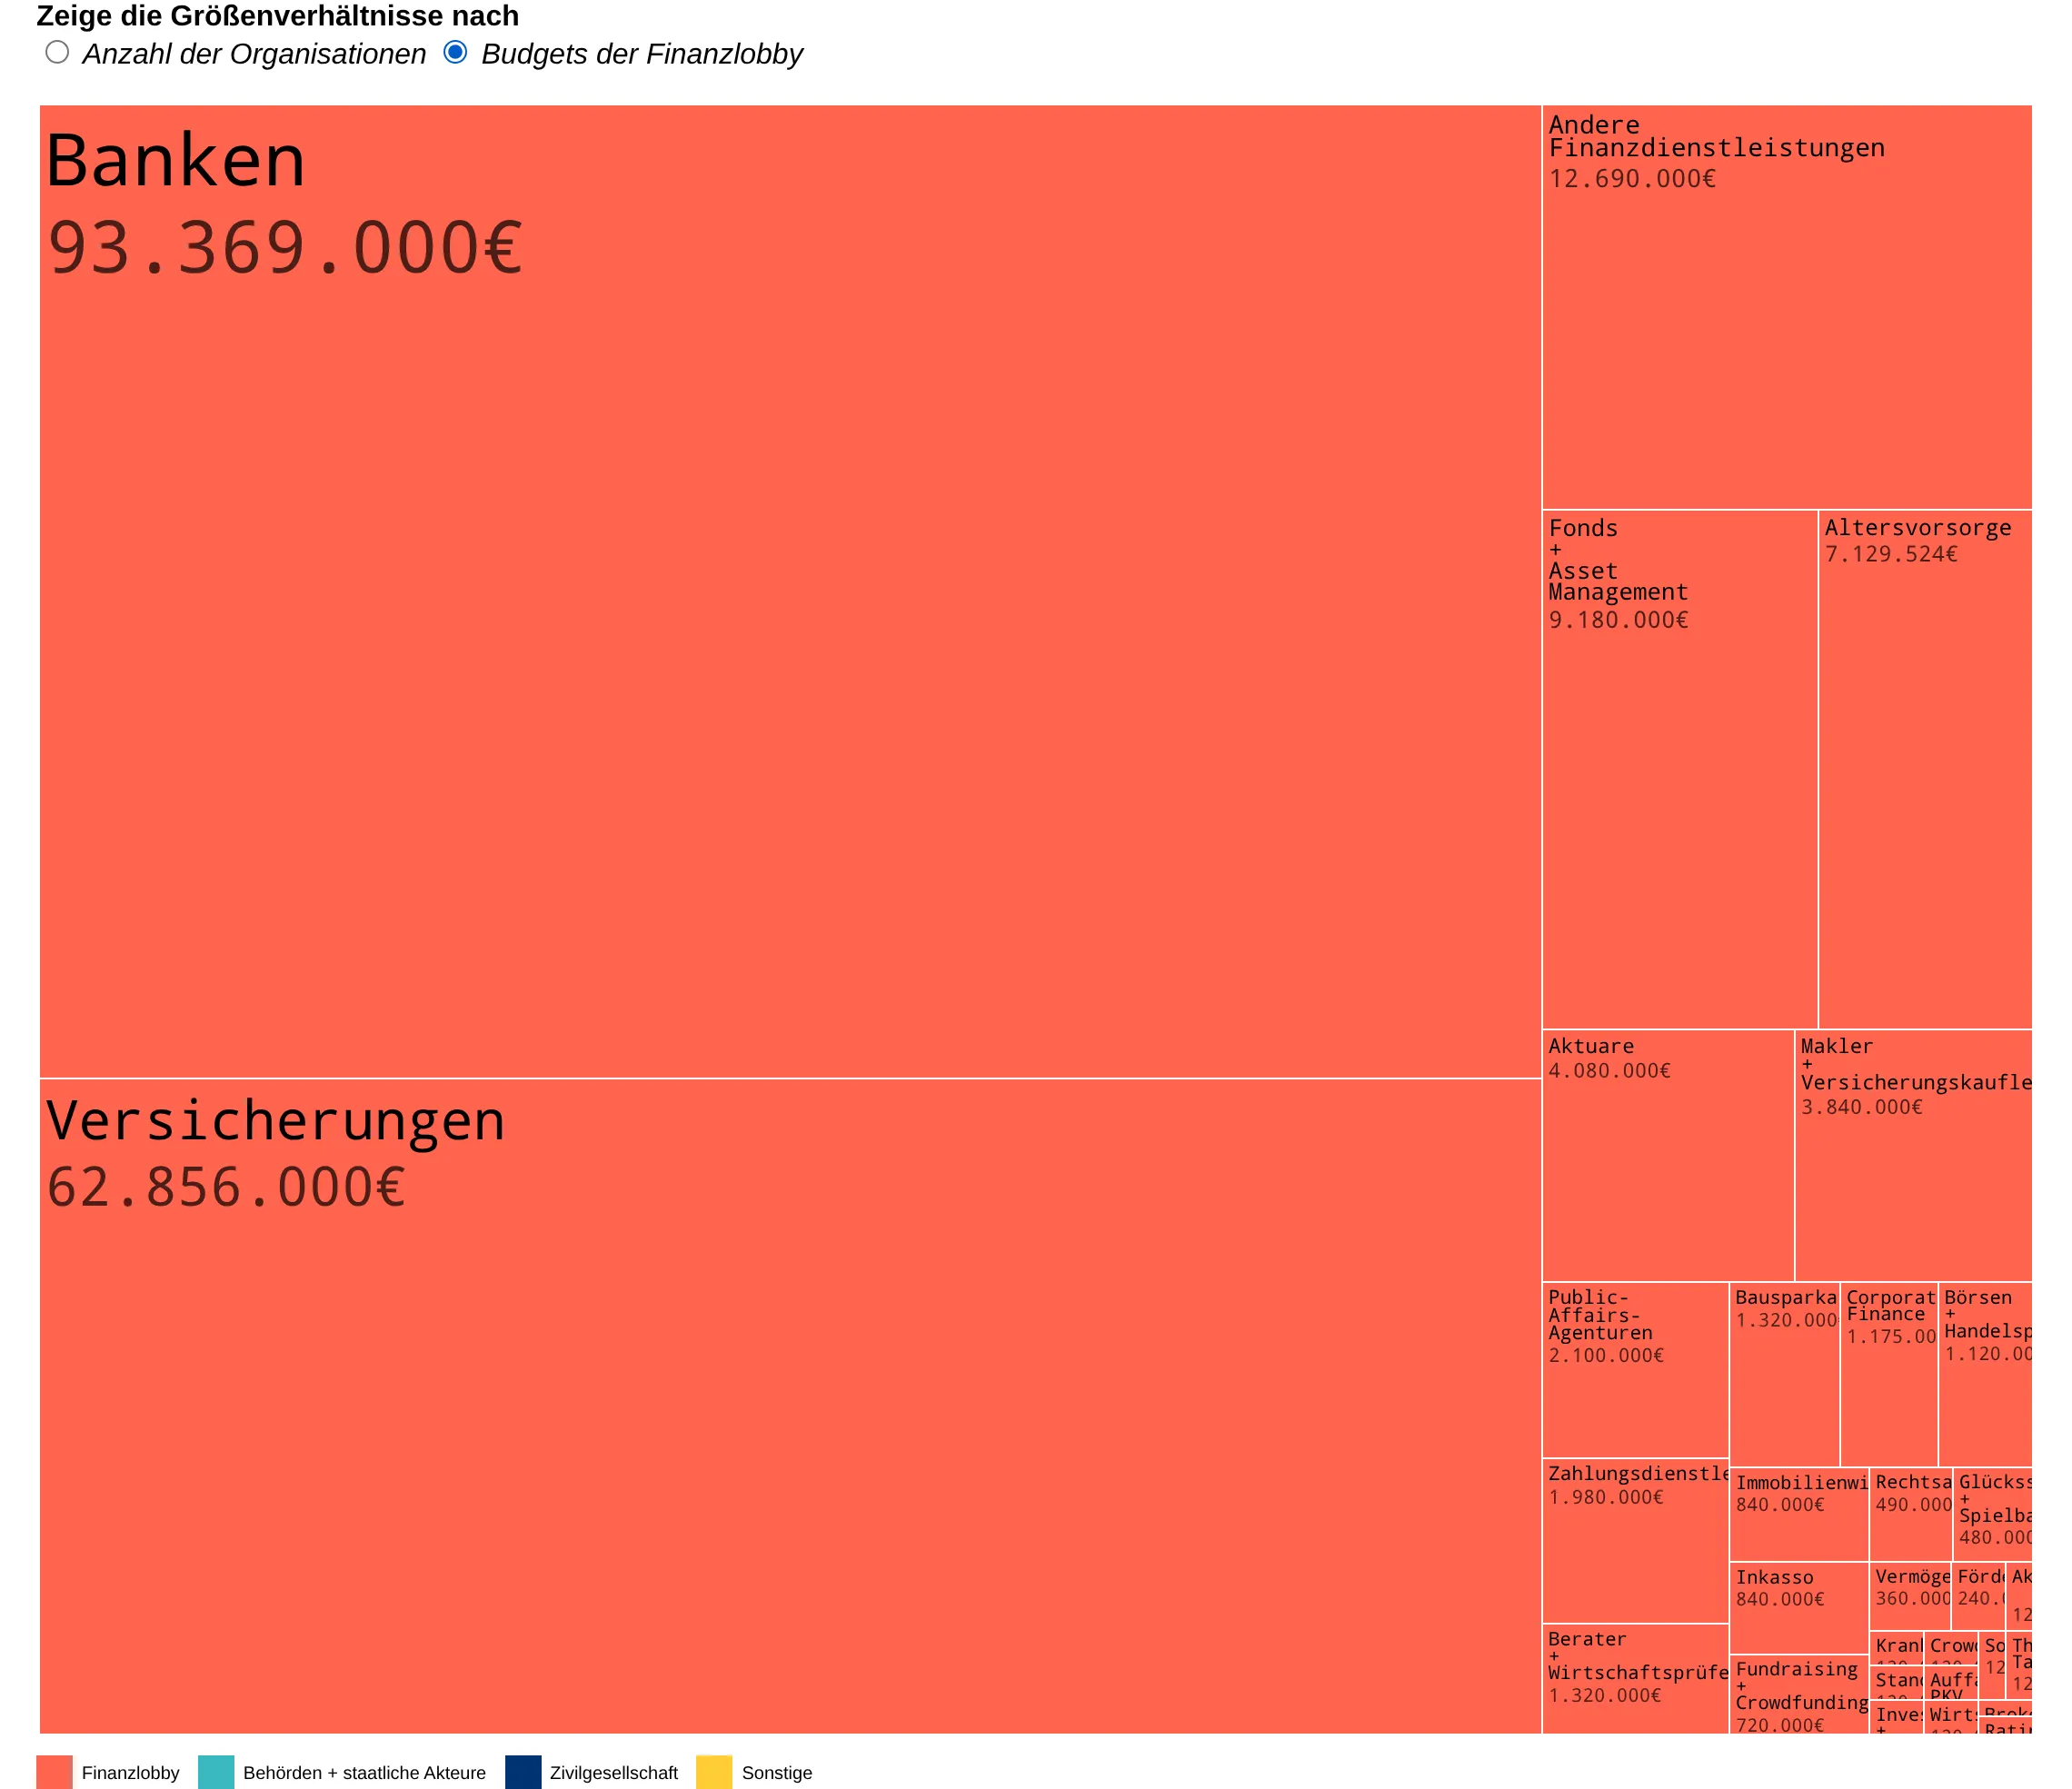
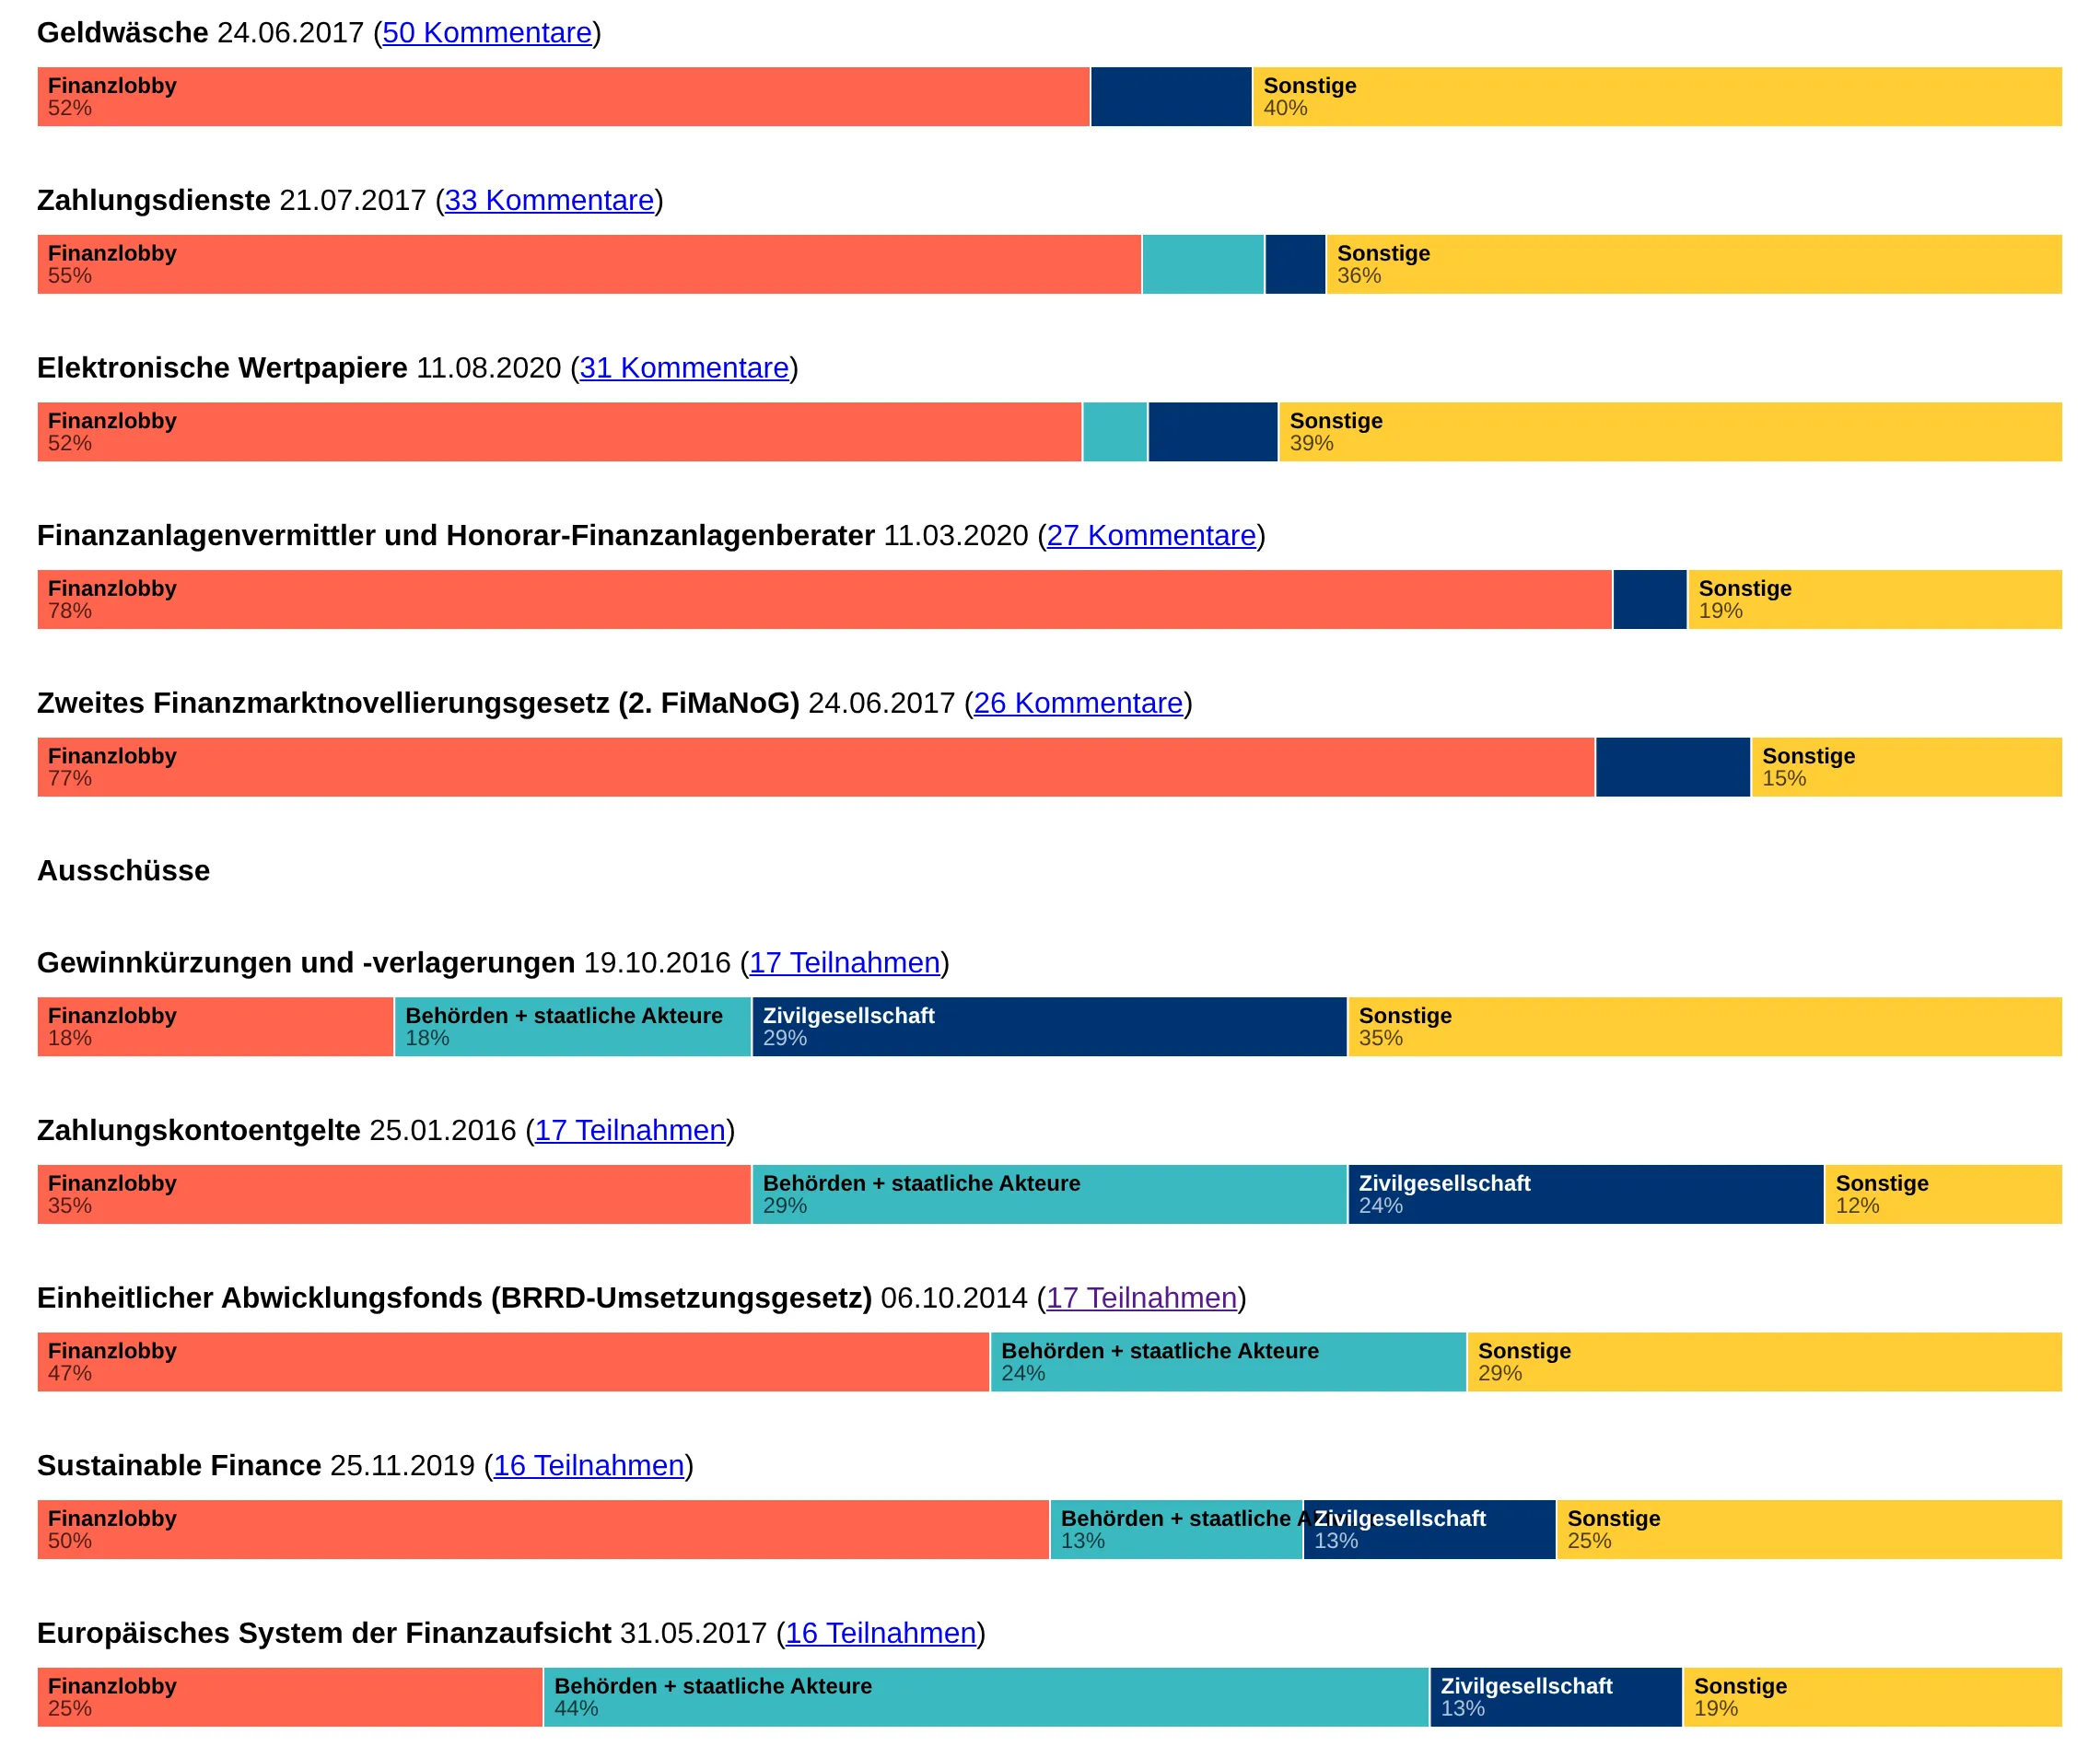
At the center sits a force-directed graph, built with d3, that lets the network form itself — circles stand for organizations, colored by sector and pulled further right the more often they took part, while the layout keeps the overall picture simple and approachable. Stacked bars show, for each draft bill and committee meeting, how the comments and statements split between the financial lobby, public authorities, civil society and others. A treemap breaks the lobbying organizations down by sector and subsector, sized by their number or, for the financial lobby, by estimated budget.
The visualizations were built with d3 and embedded via Observable, so they lived directly inside the article — a tool for readers to explore the world of financial lobbying in Germany on their own terms.
Six years earlier, Lorenz Matzat and I had mapped the Swiss parliament’s lobbyists for NZZ in Wandelhalle.
Images
Left and right arrow keys flip through the pile, Enter enlarges the top image.