Visualizing the German Digital Library
The millions of objects in the German Digital Library, laid out by era and sector rather than behind a search box.
The German Digital Library (Deutsche Digitale Bibliothek) aggregates millions of digitized artifacts from German cultural and scientific institutions, a collection so large that its search box reveals almost nothing about what is actually in it.
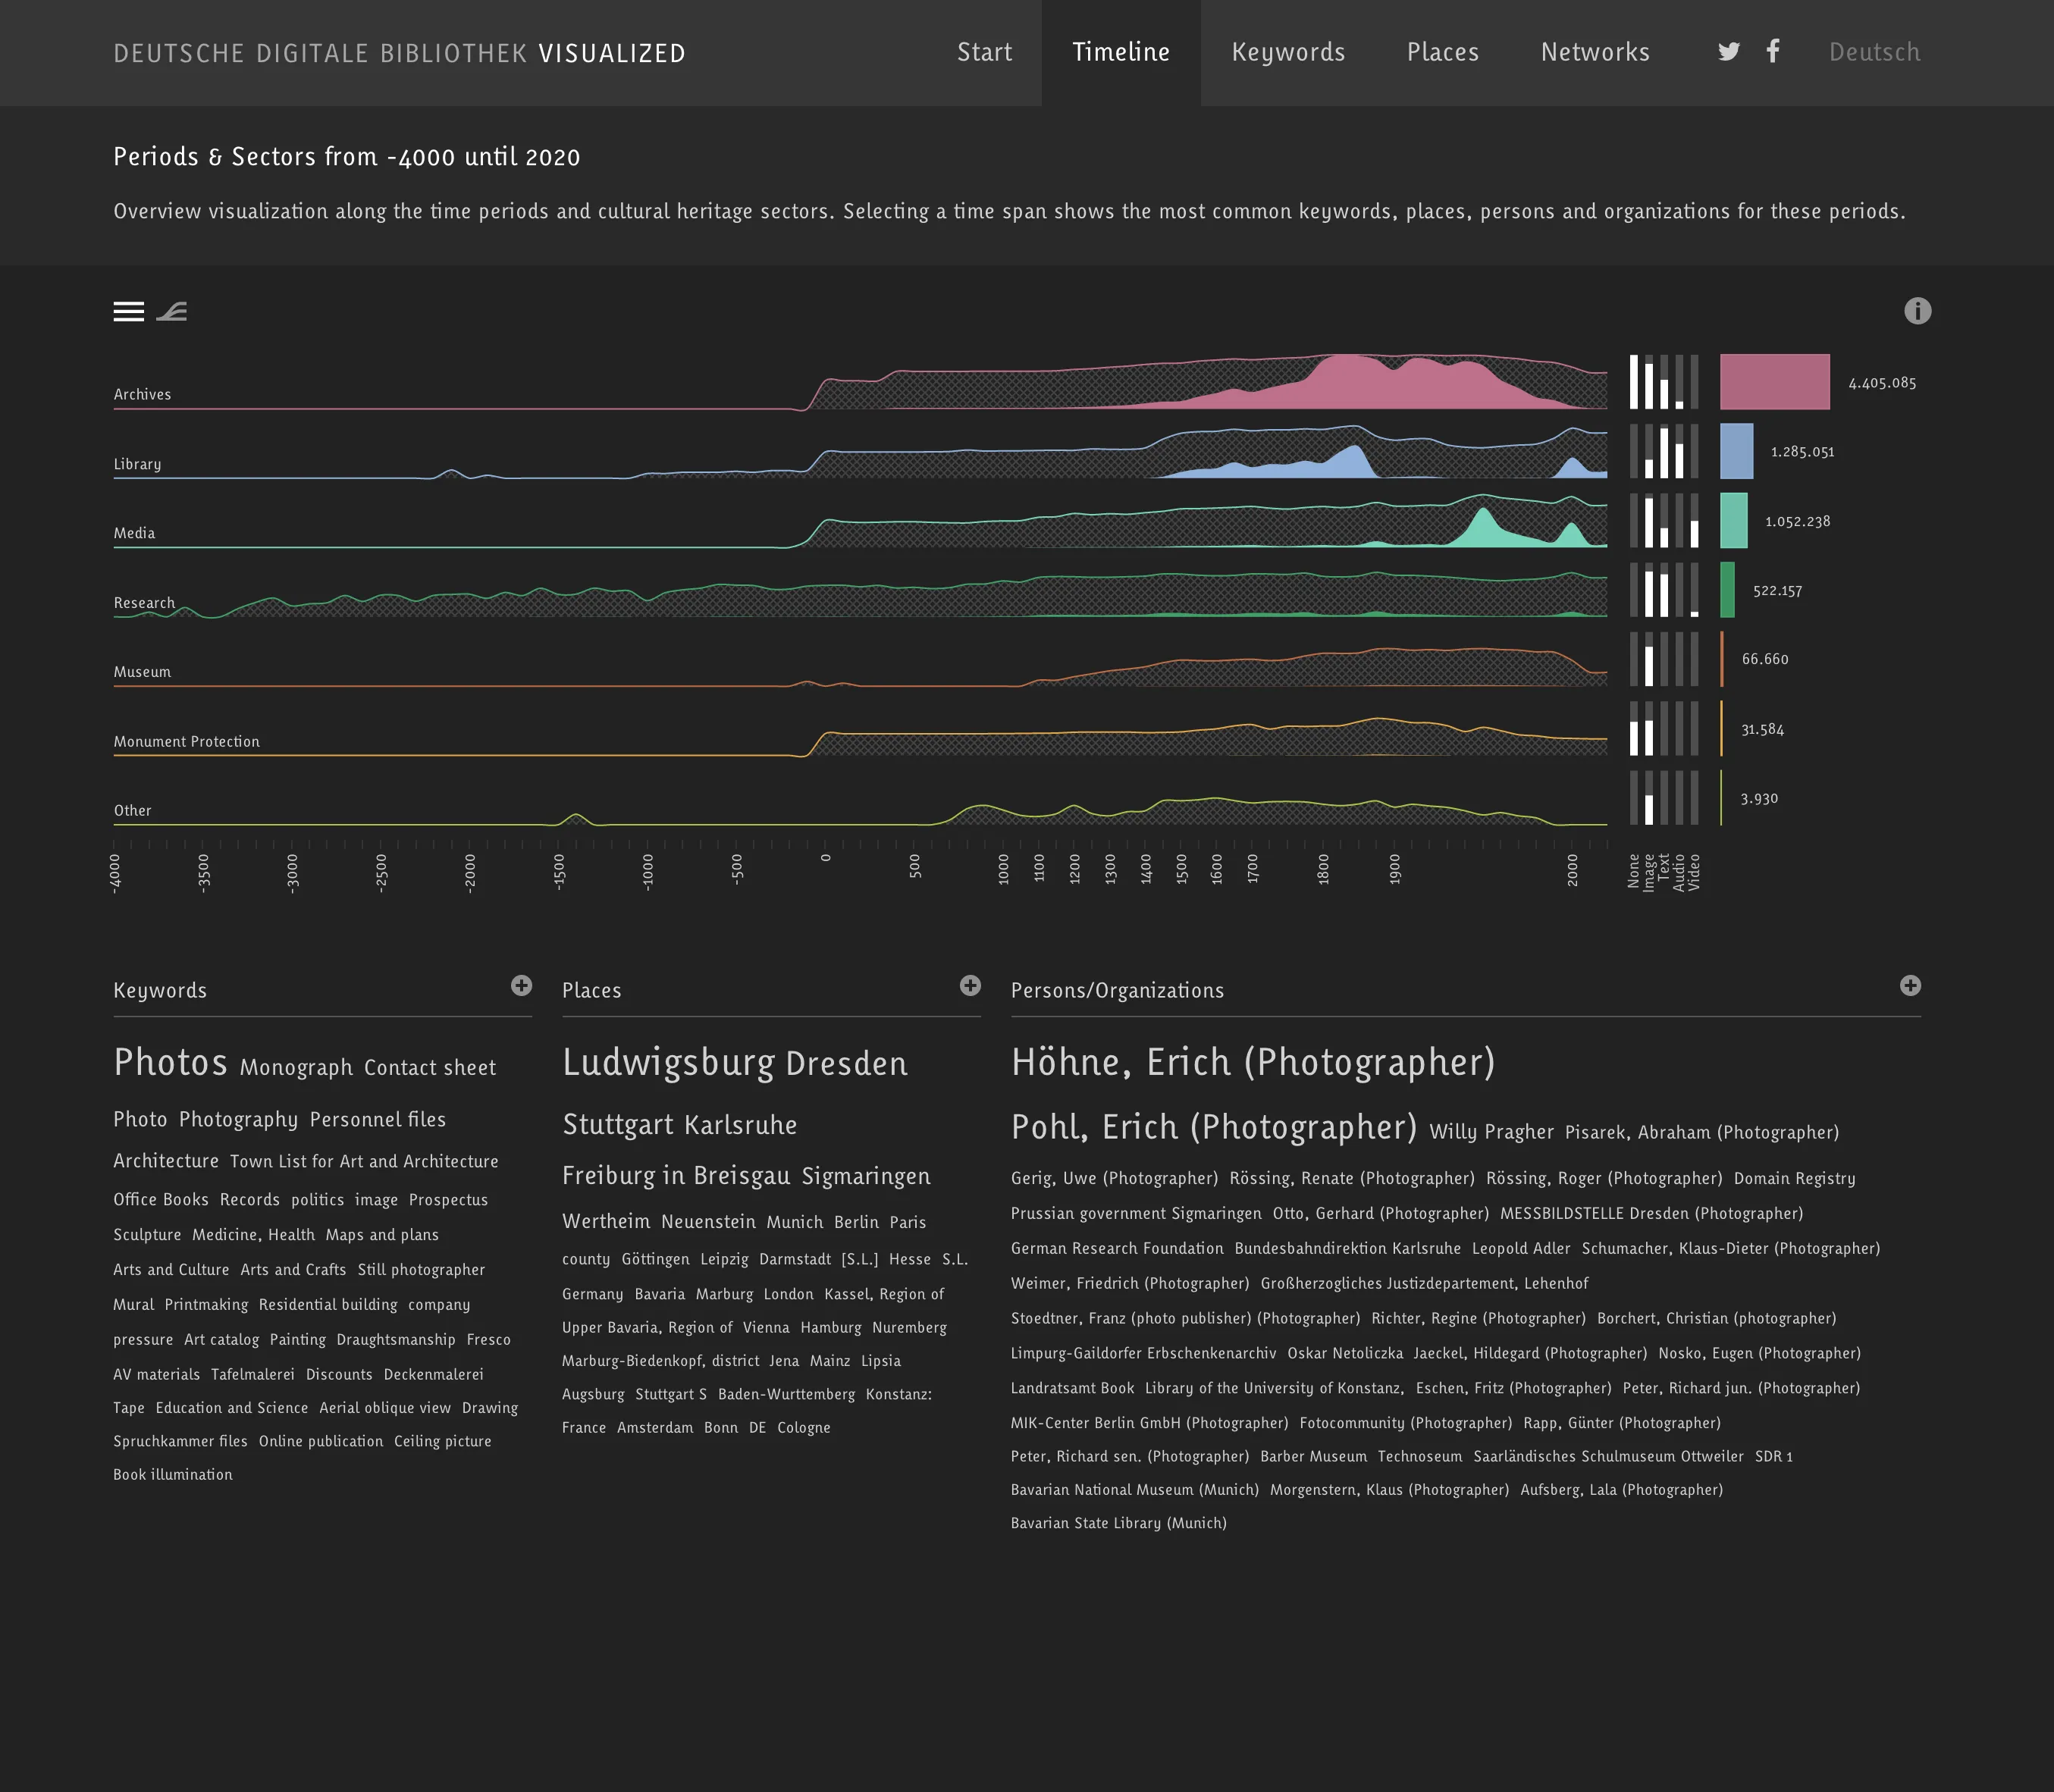
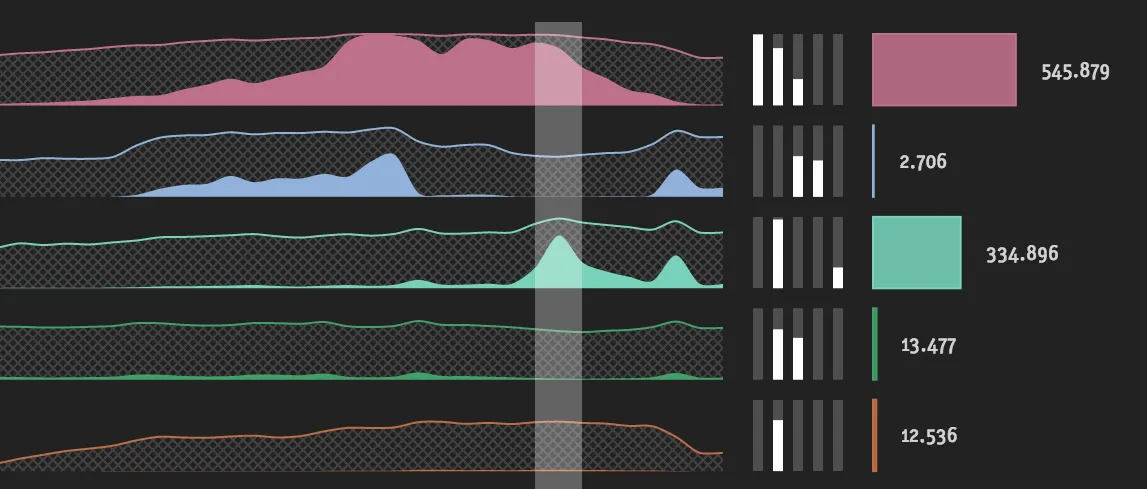
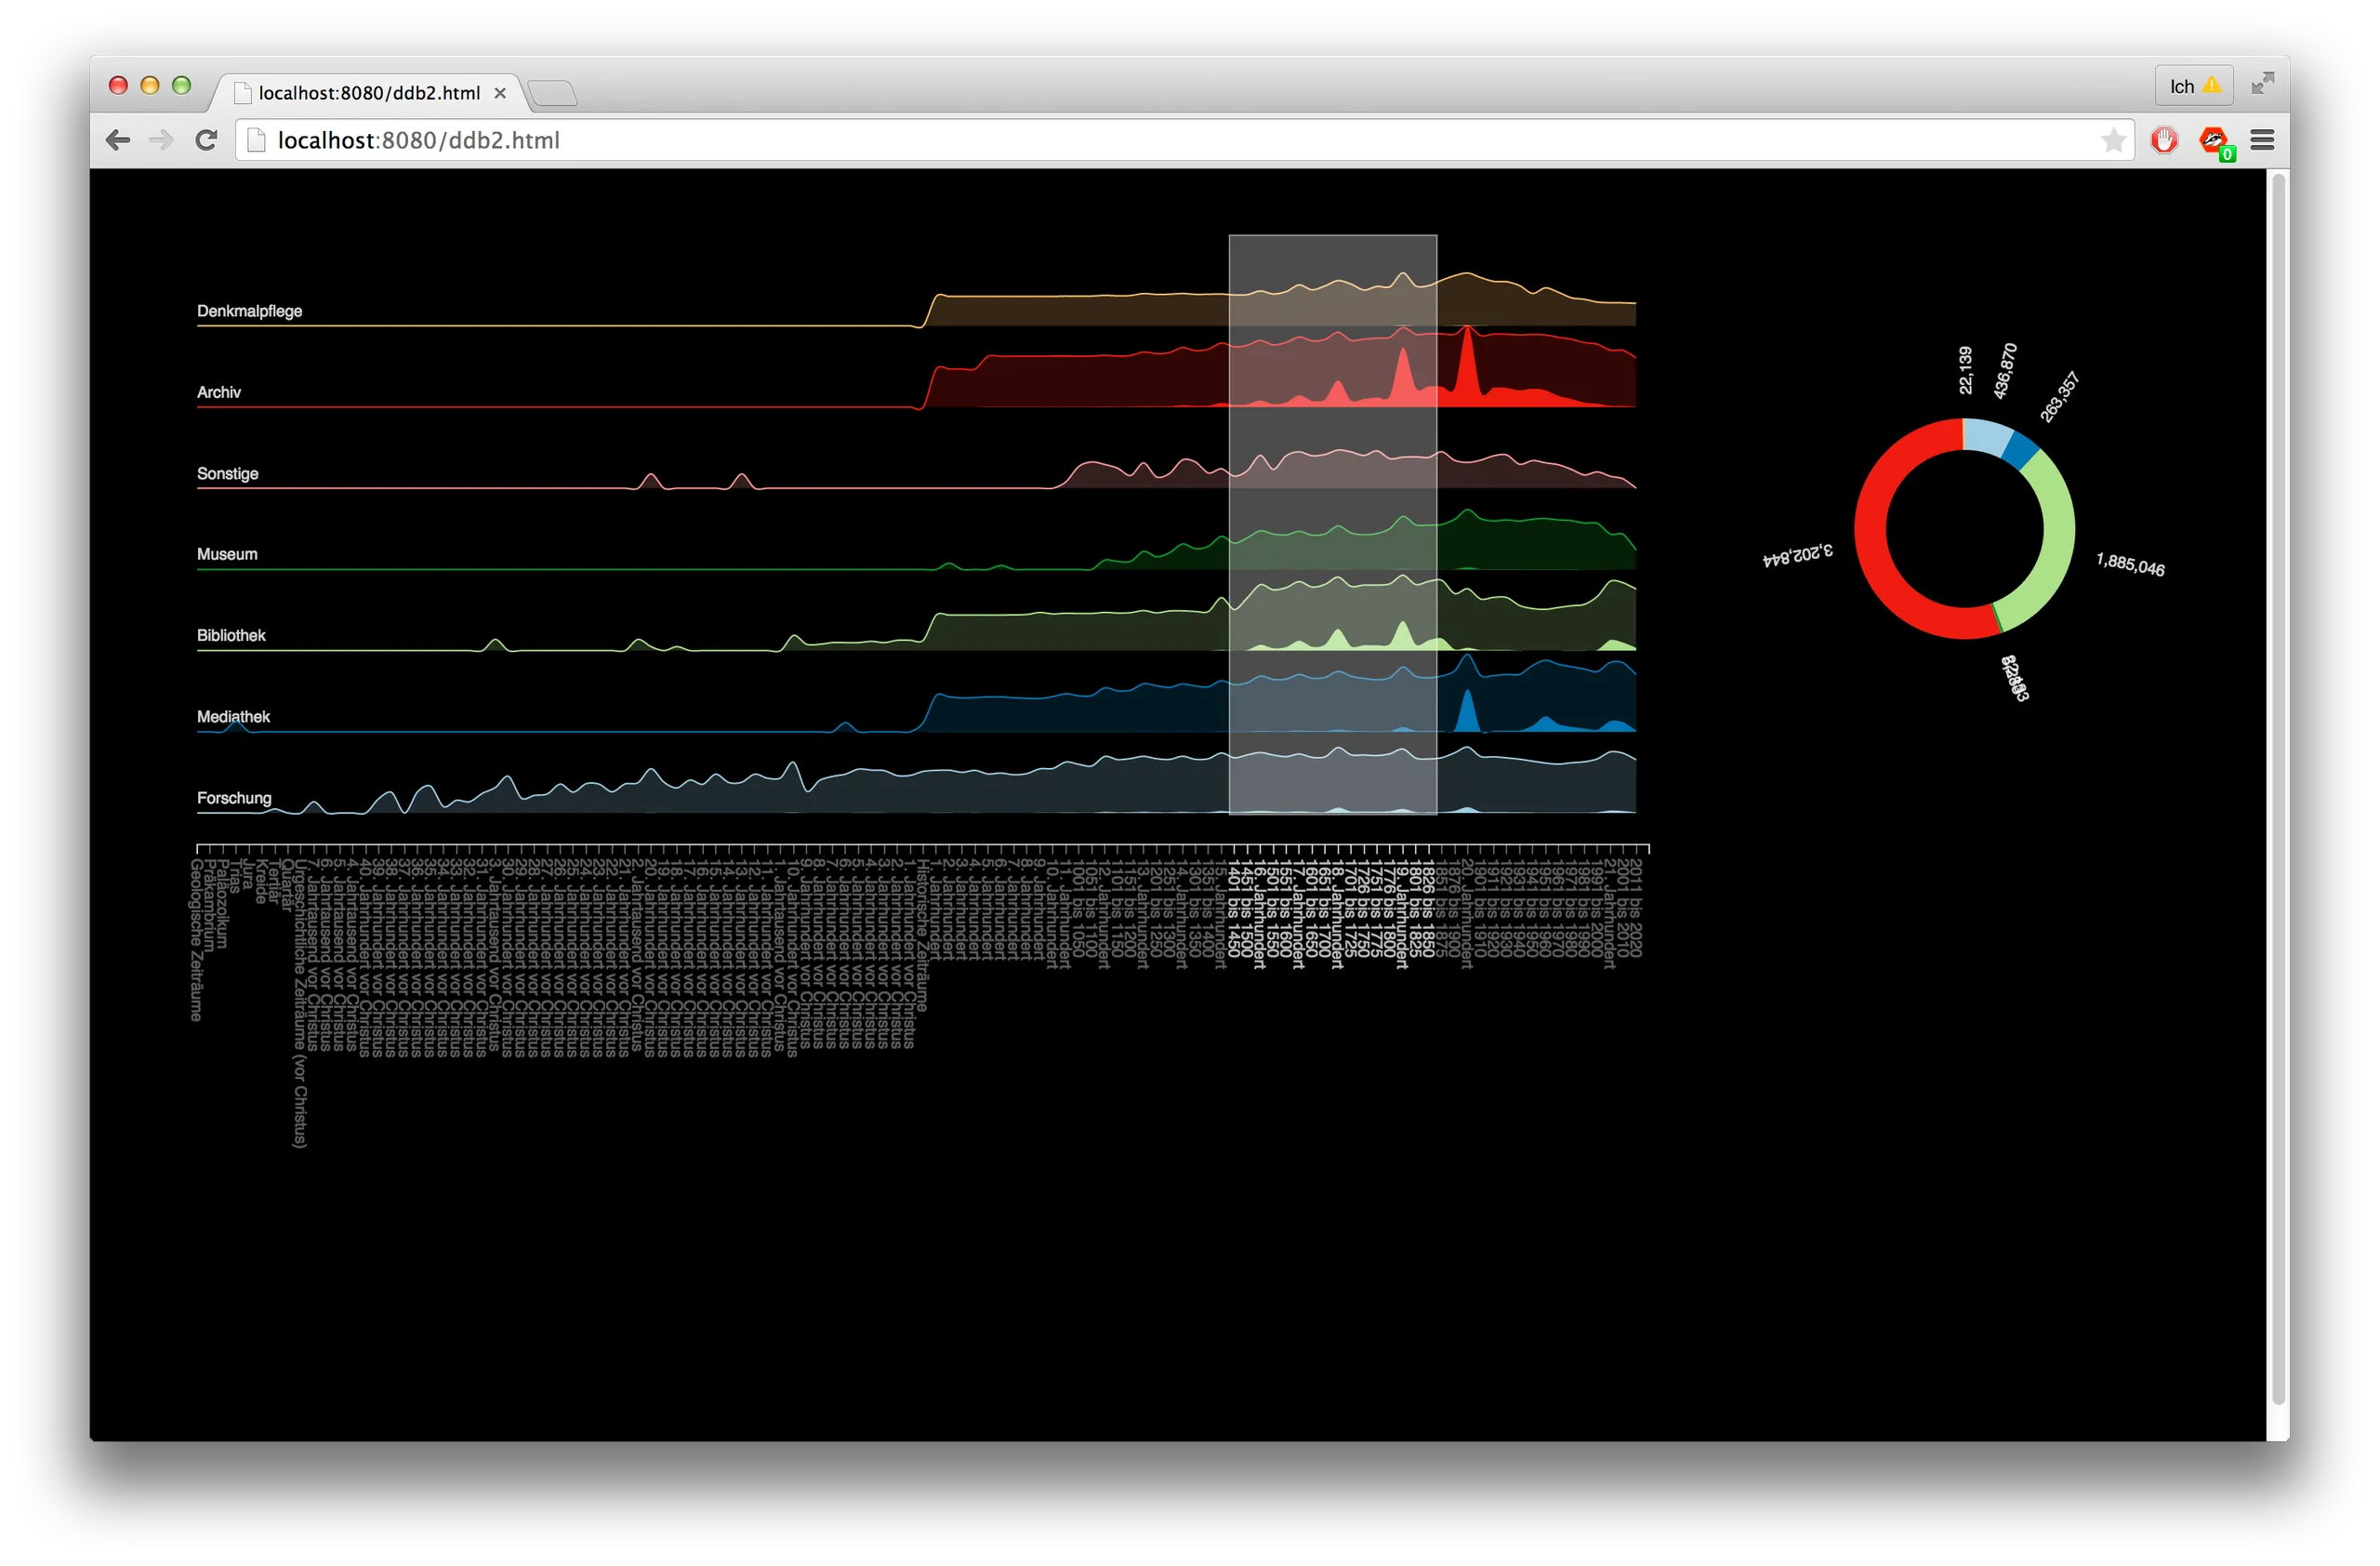
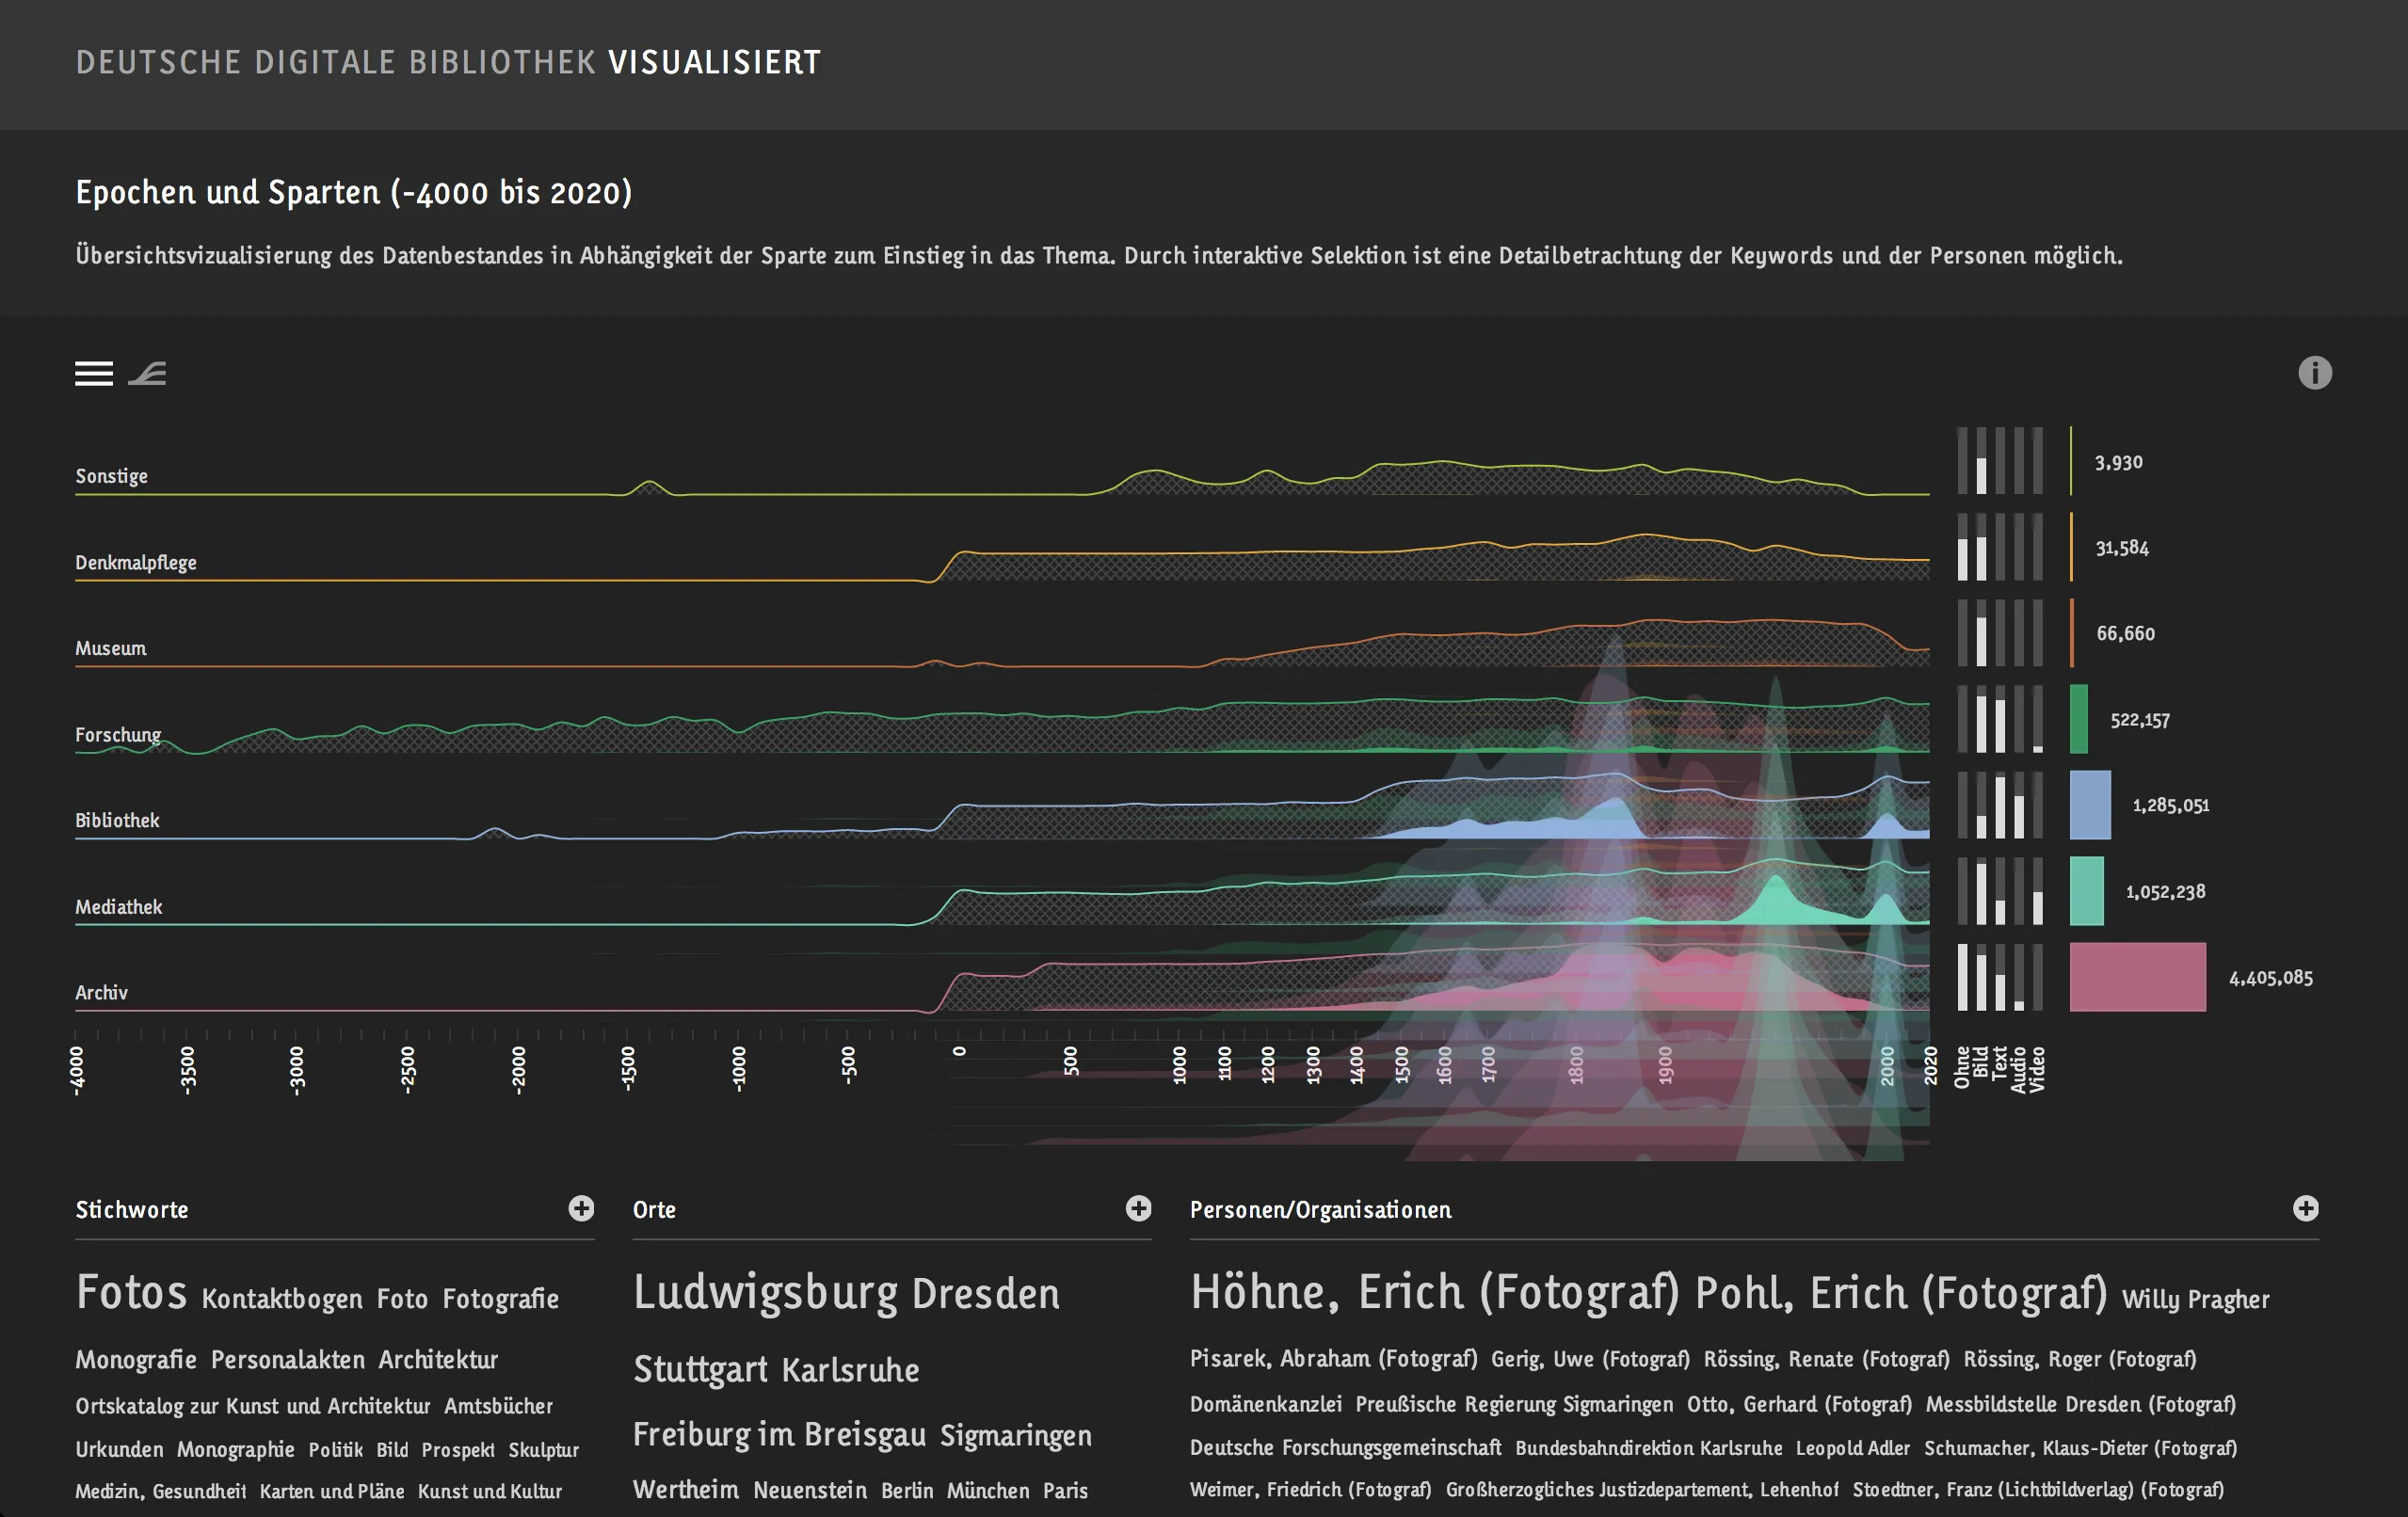
To offer a glimpse into this cultural treasure, I created the overview visualization that opens »DDB visualisiert«, where each of us built one view: a timeline that lays the entire collection out along time periods and cultural heritage sectors. Selecting a time span surfaces the most common keywords, places, people, and organizations for those years: patterns of an era rather than a page of search results.
Where existing interfaces show a handful of objects in ordinary result lists, the visualization shows the distribution of many: how the collection spreads across time, place, topic, and people, and where its dense and empty regions lie.
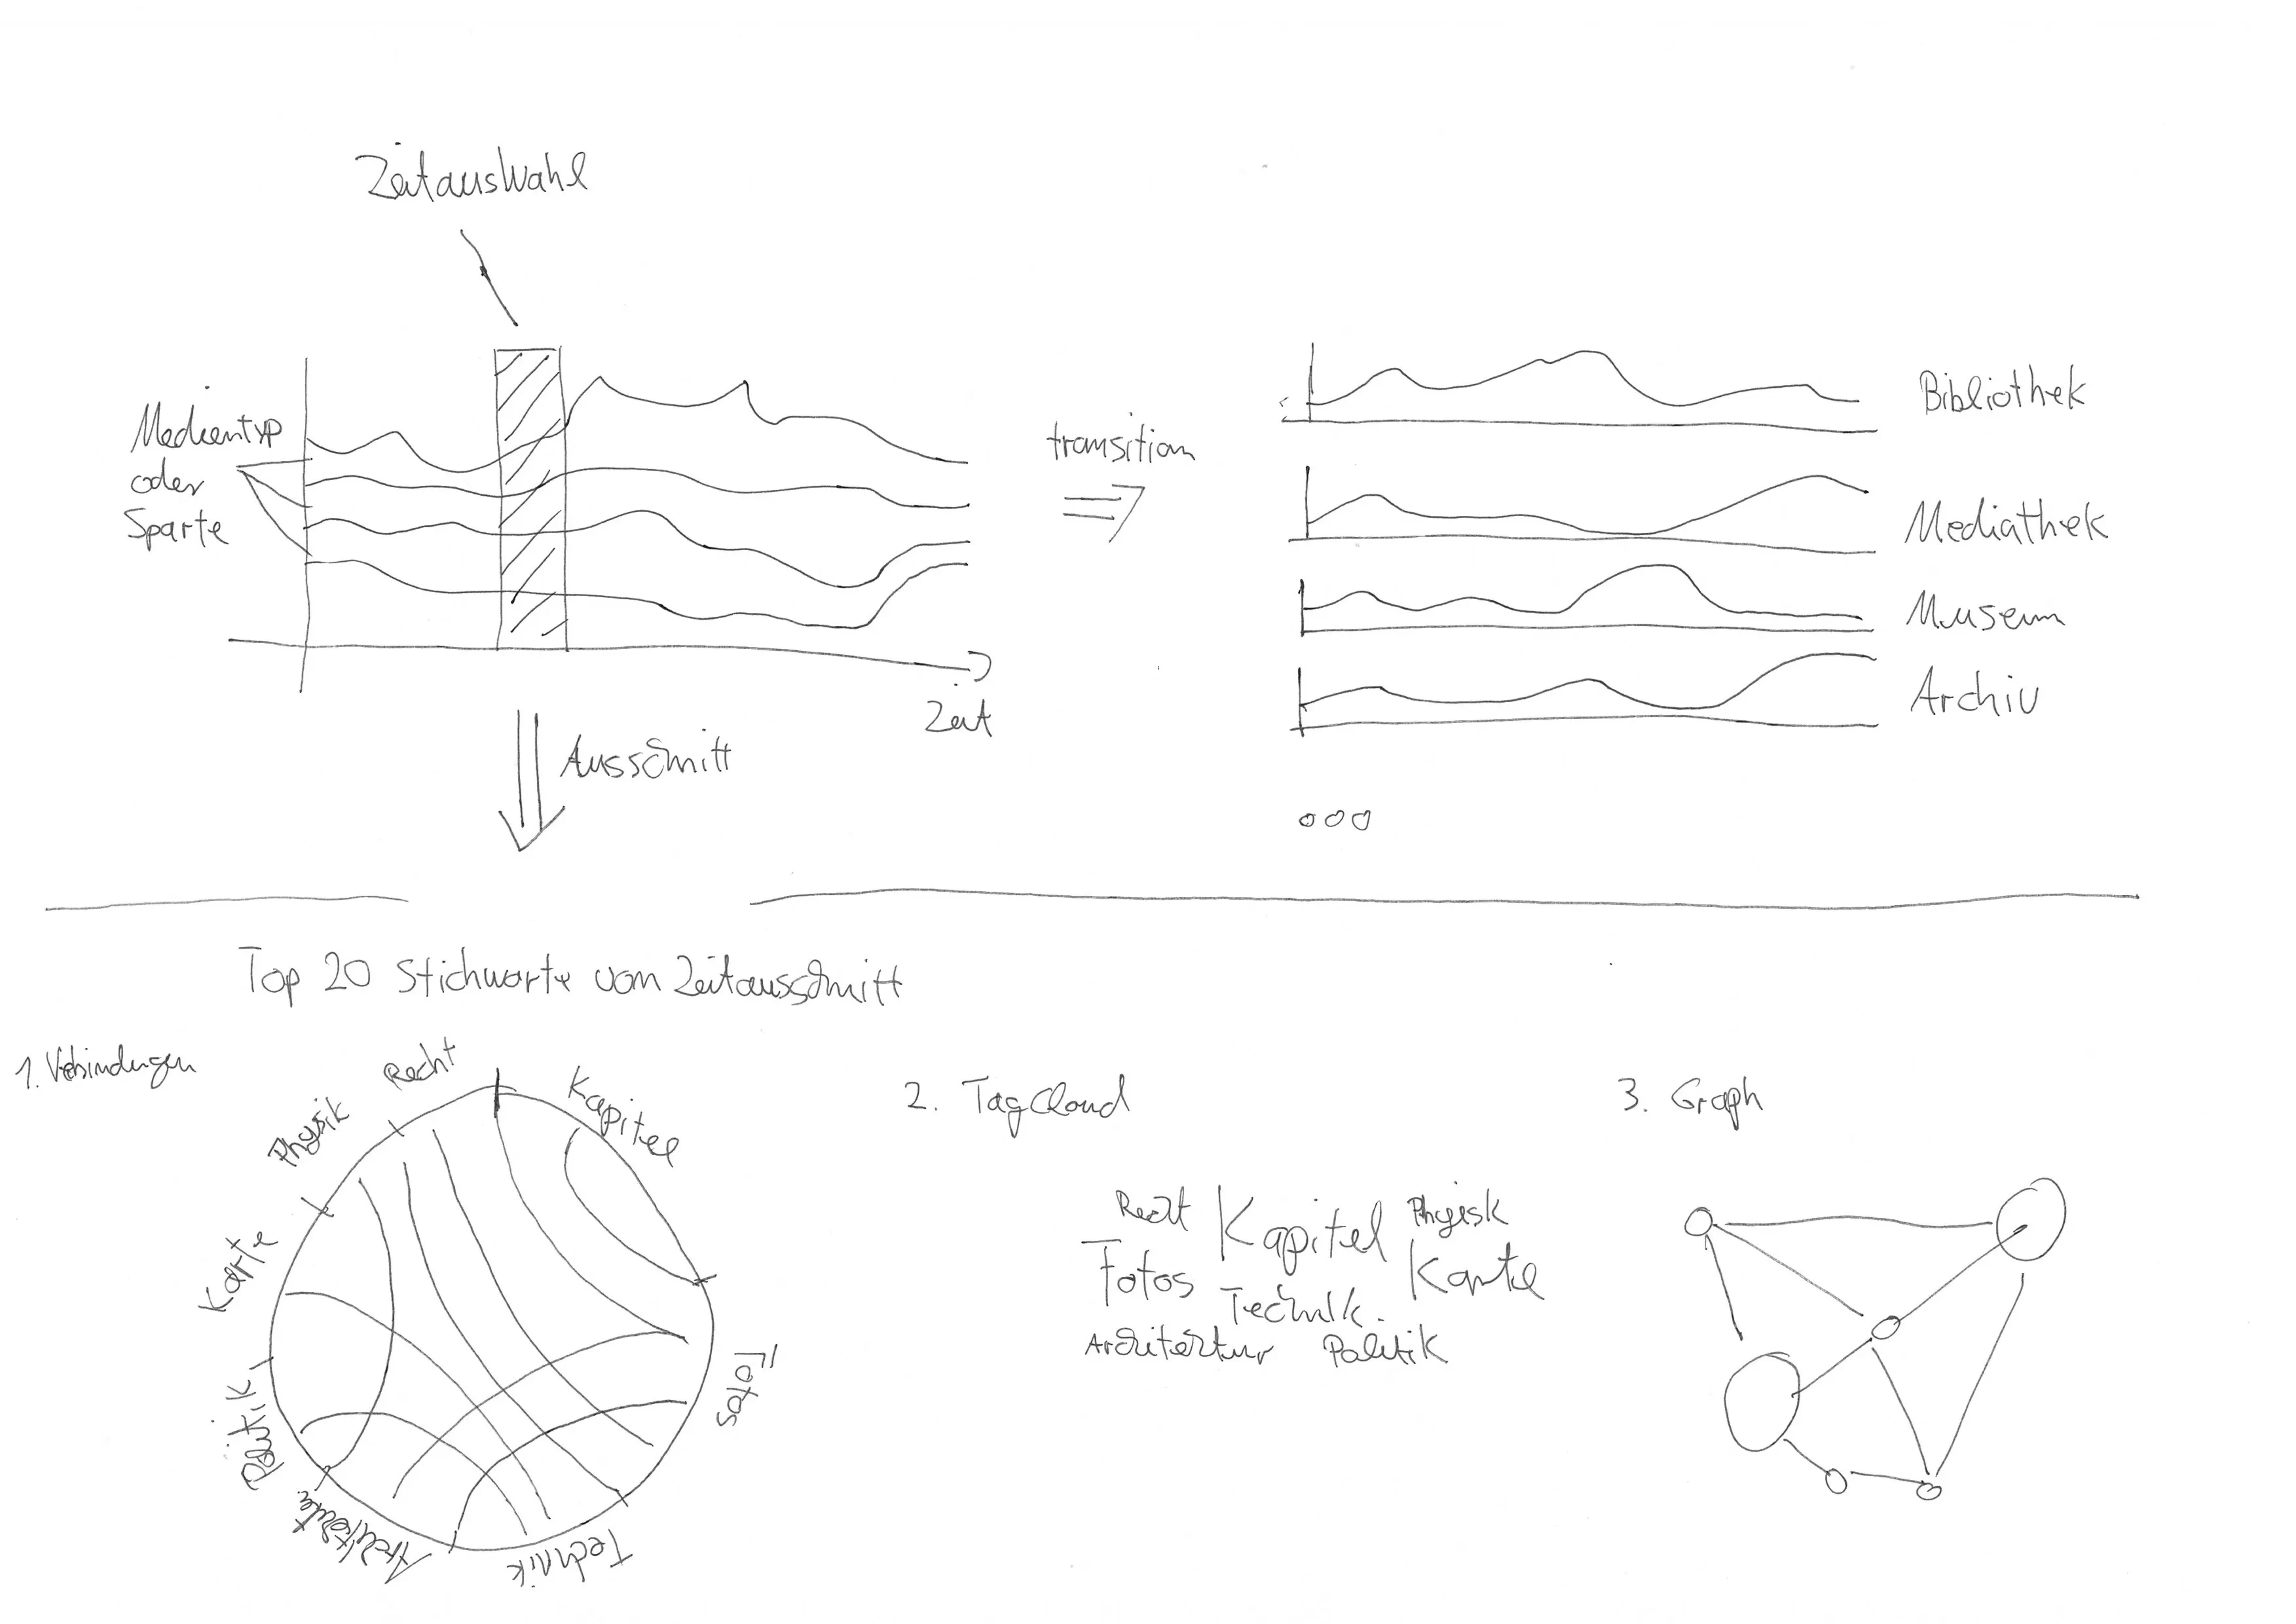
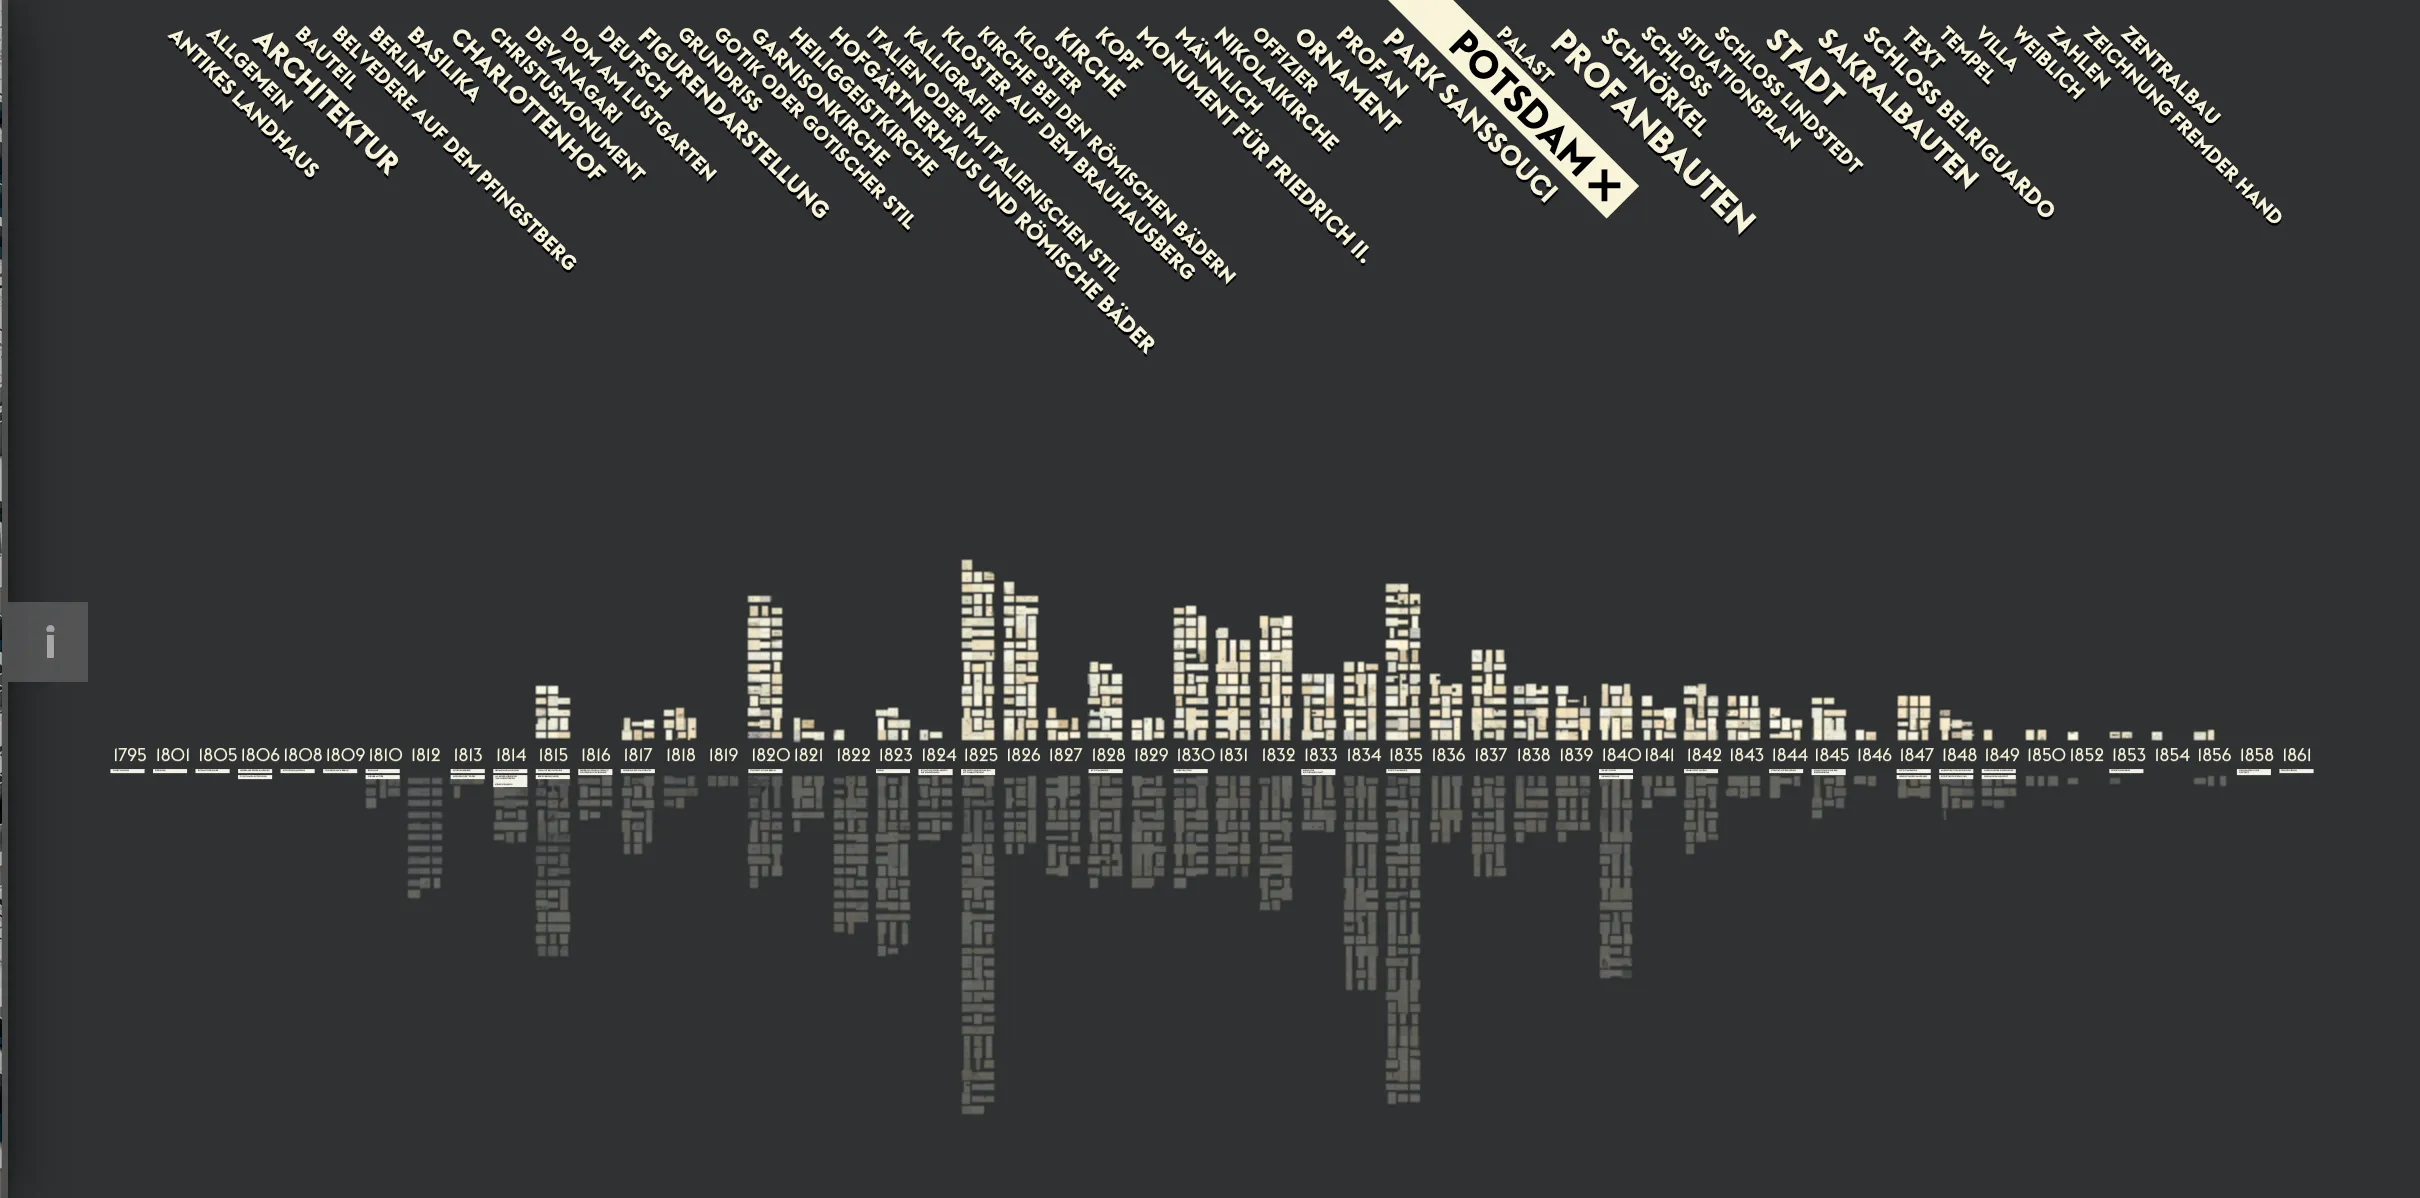
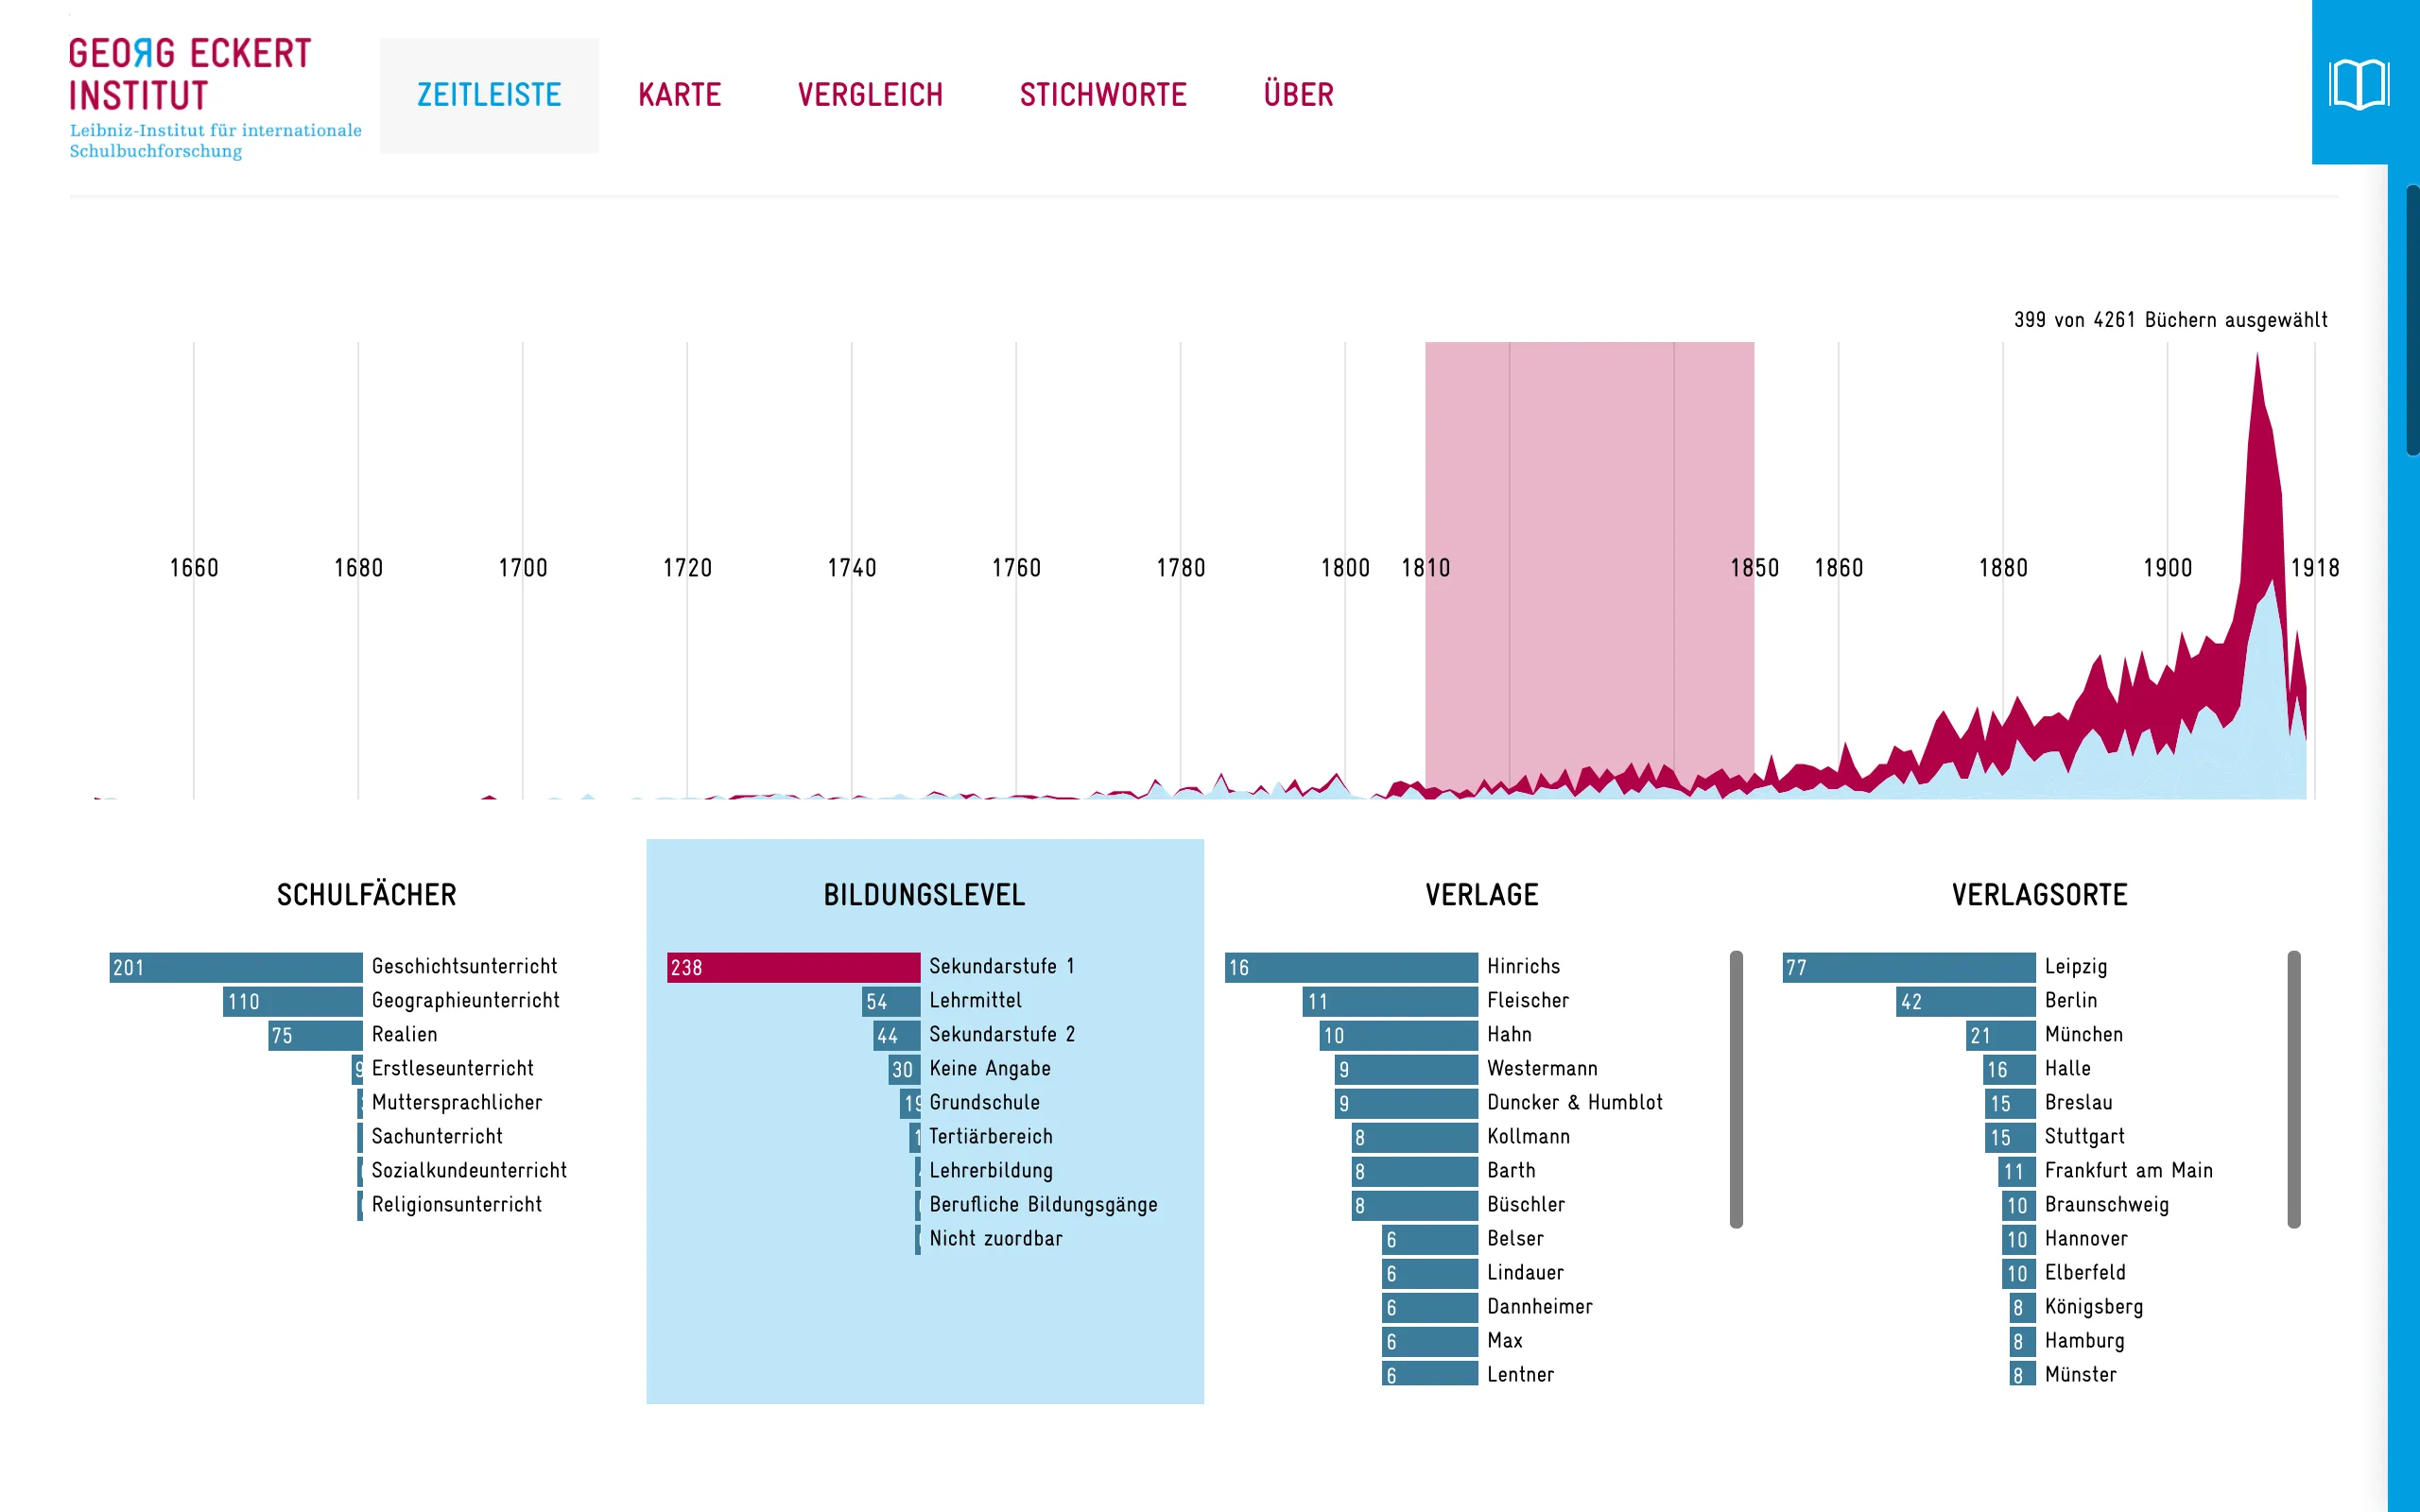
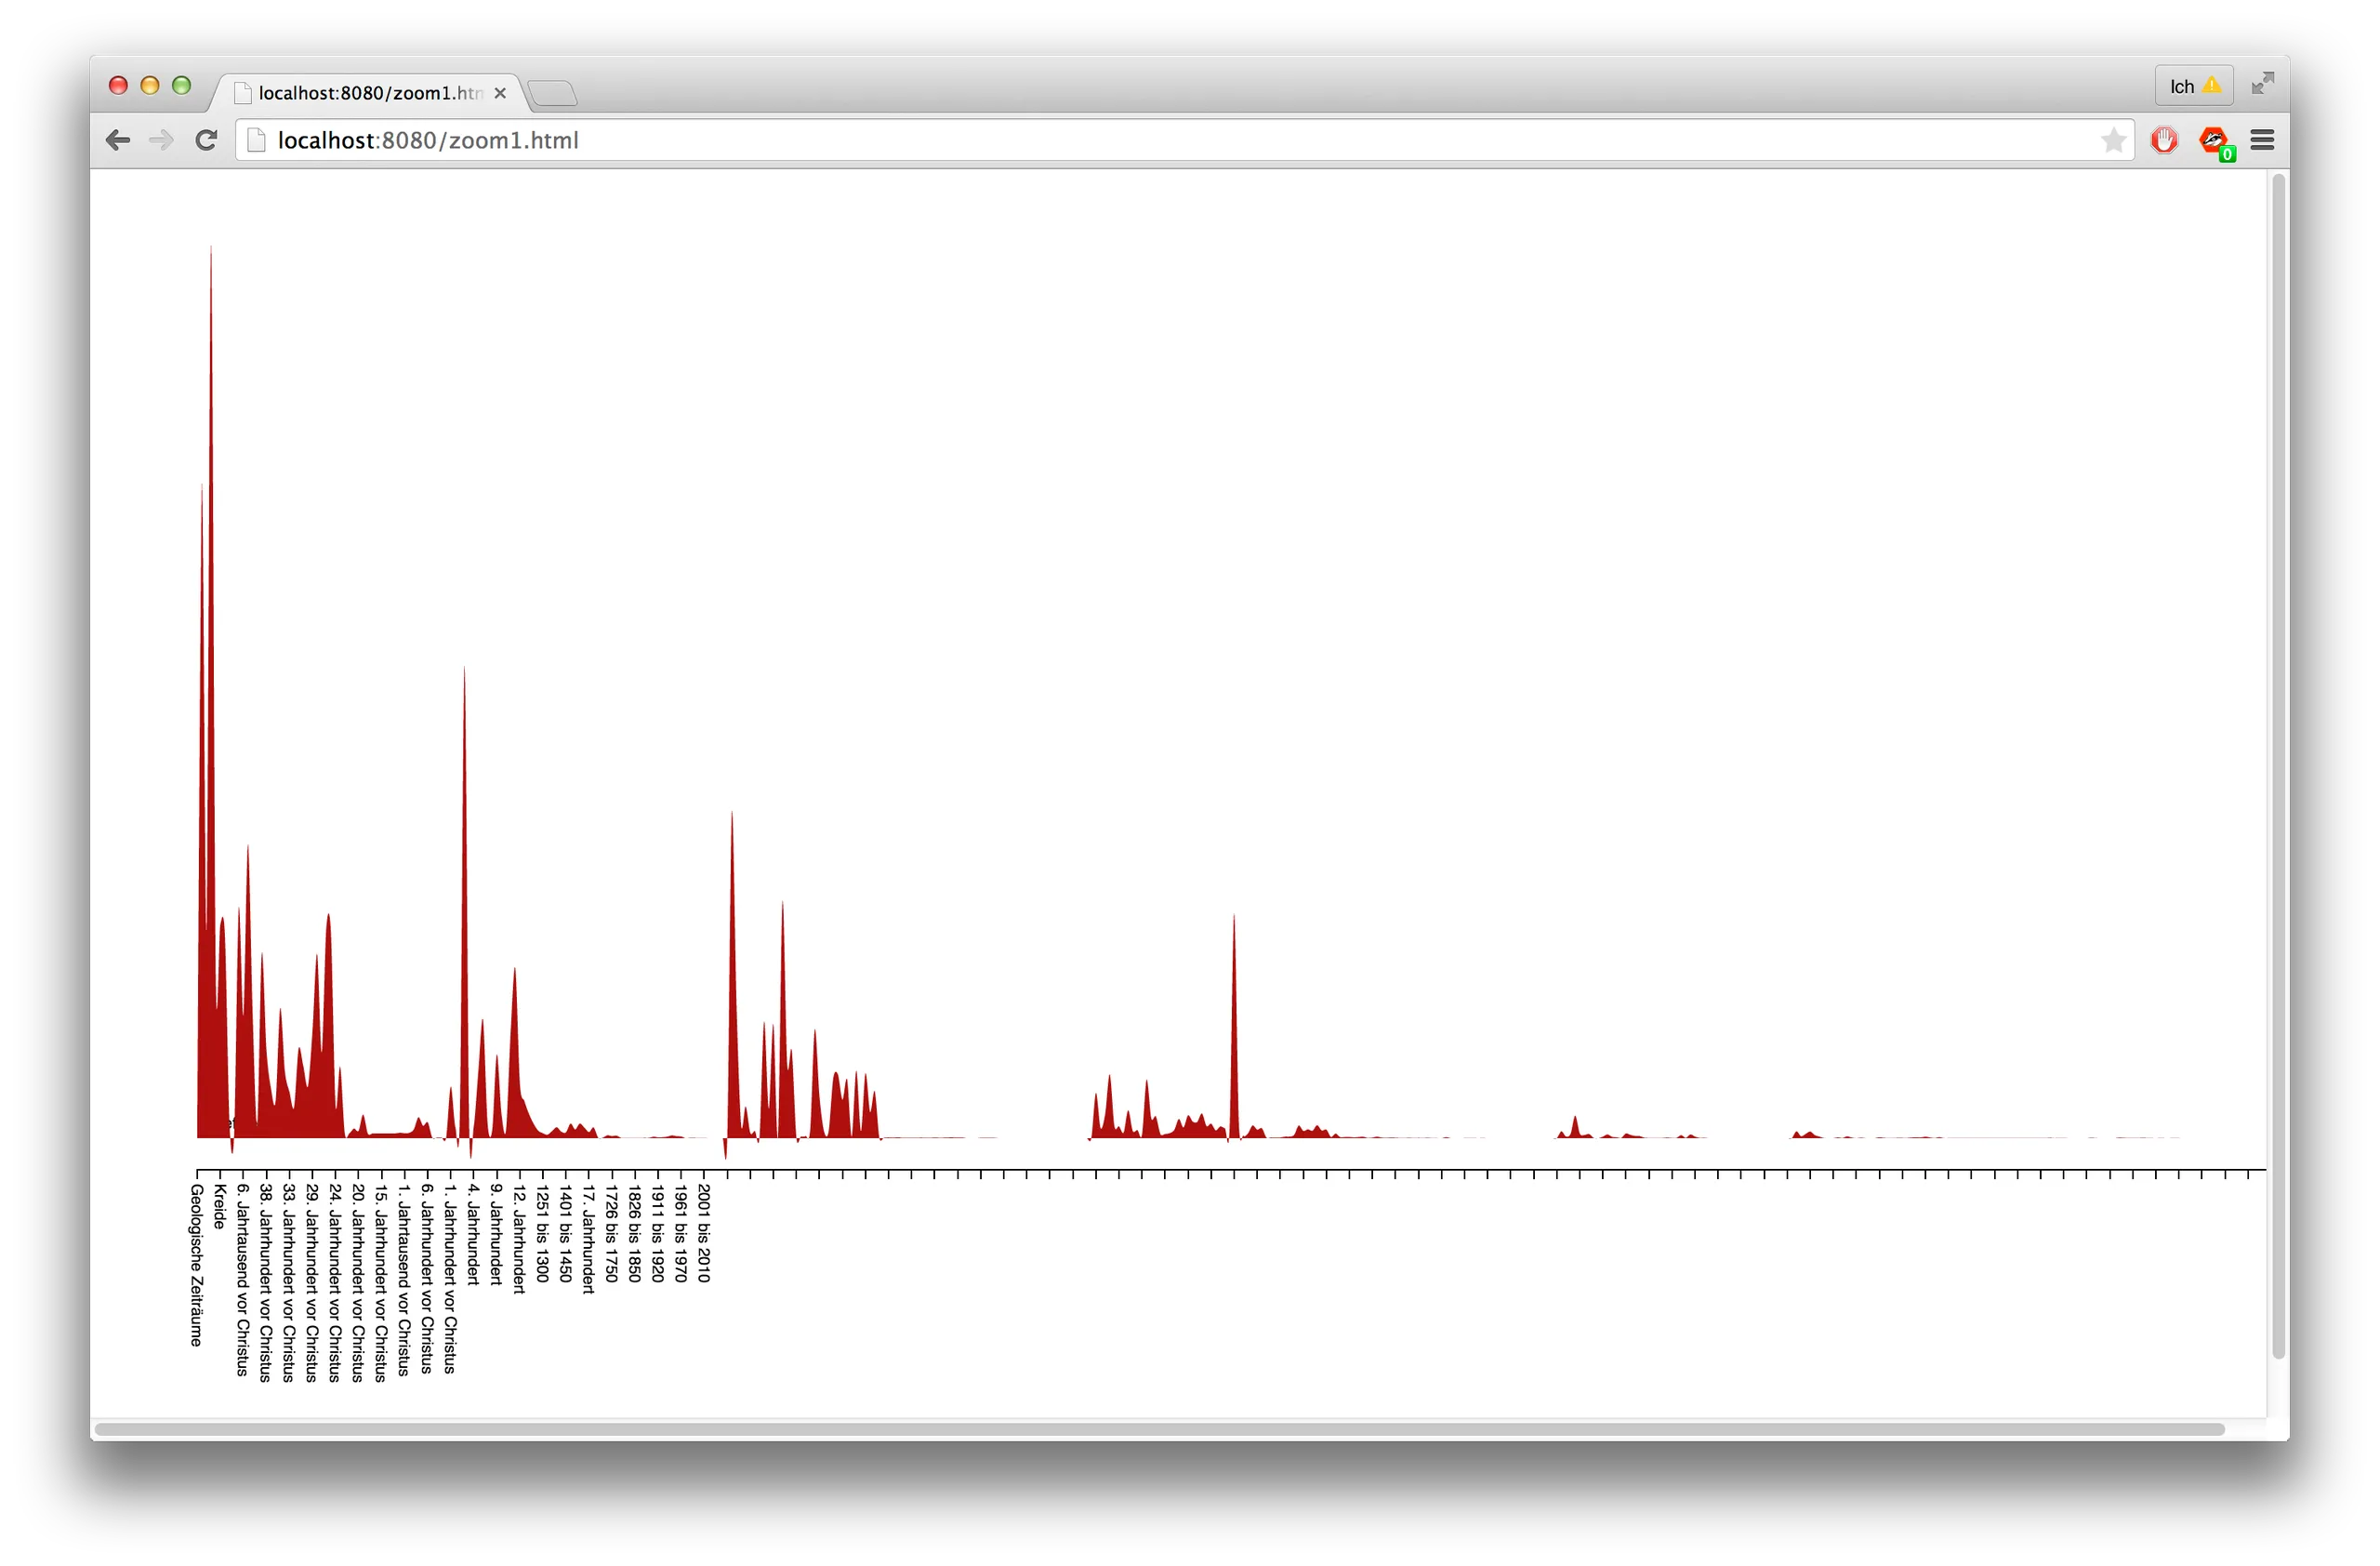
The visualization was developed at the Urban Complexity Lab under the scientific supervision of Marian Dörk, with consulting by Stephan Bartholmei and sibling visualizations by Gabriel Credico (networks) and Christian Bernhardt (keywords/places). Some of the design process is documented in screenshots. Gabriel and I later built GEI-Digital Visualized together.
Images
Left and right arrow keys flip through the pile, Enter enlarges the top image.