Broadband Berlin
An interactive portrait of Berlin's broadband network for Technologiestiftung Berlin, tracing five years of rollout across the city's neighborhoods and mapping 50 Mbit/s coverage block by block.
Fast internet, like electricity, is mostly taken for granted and noticed only when it is slow or gone. »Breitbandausbau Berlin«, commissioned by Technologiestiftung Berlin, brings that infrastructure into view, at a time when Germany was aiming for nationwide coverage of at least 50 Mbit/s by 2018. Sebastian Meier of VISLAB and I conceived, designed and produced it together; the foundation hired me directly.
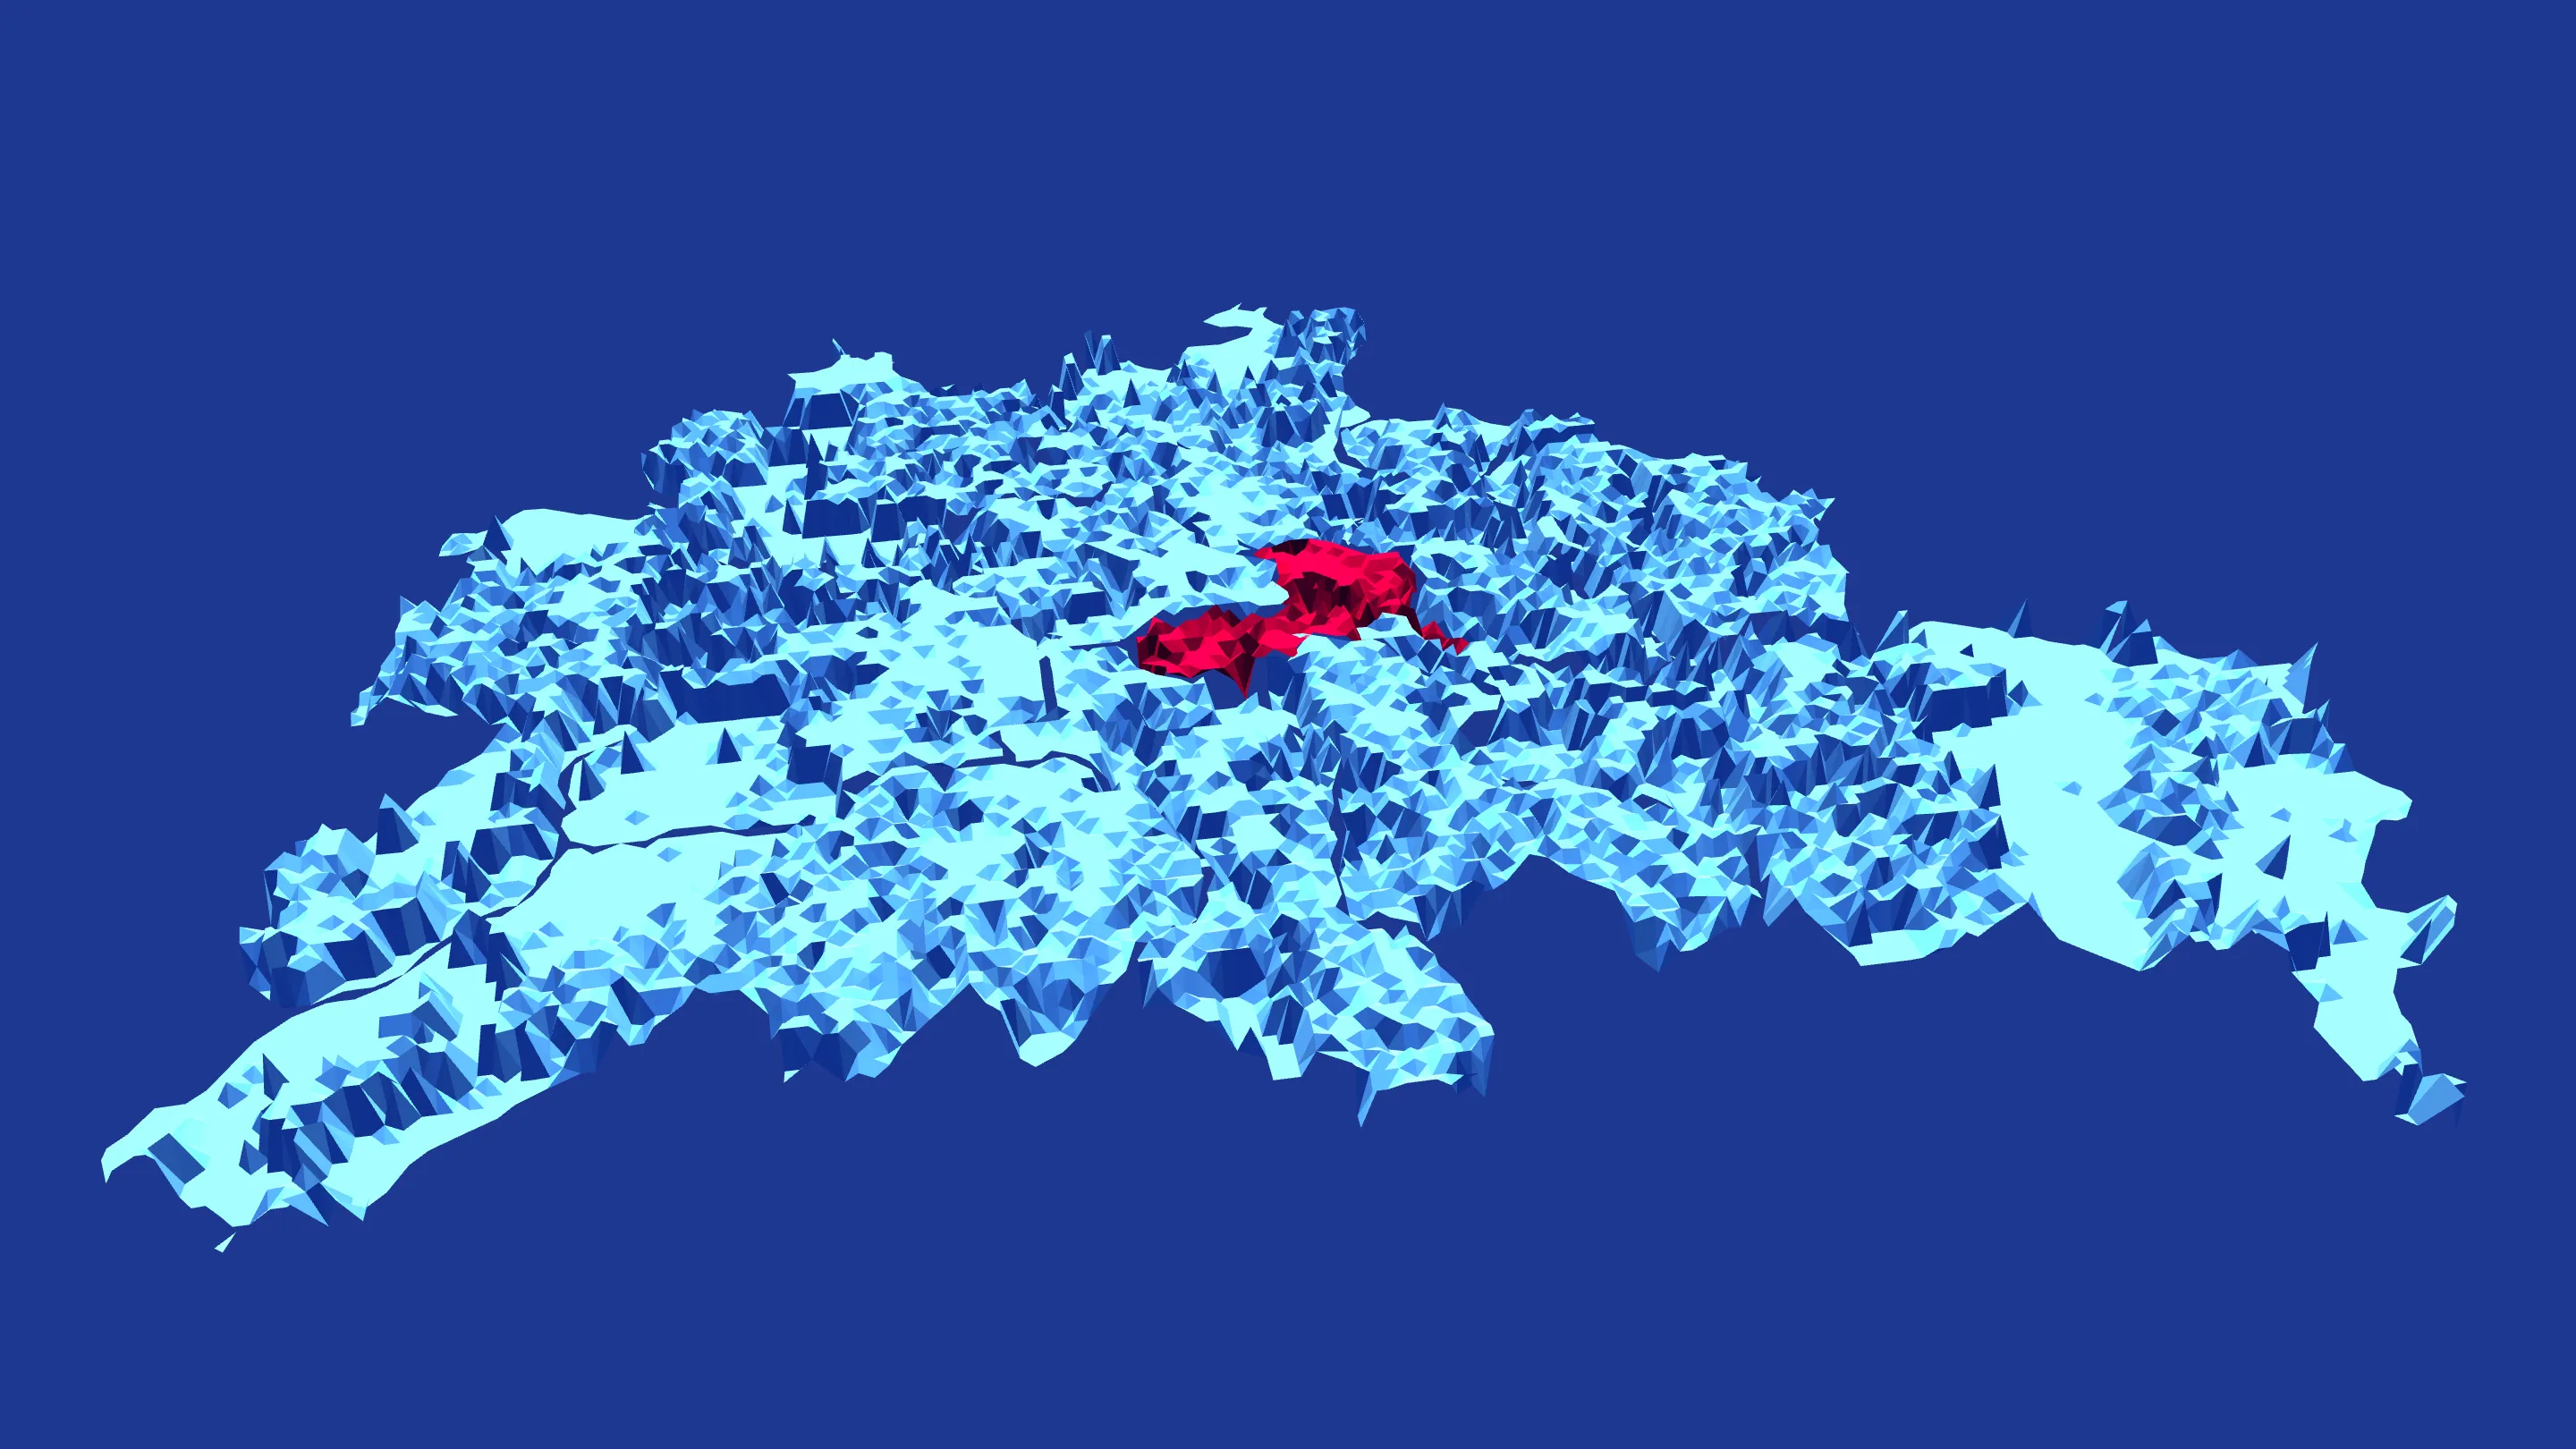
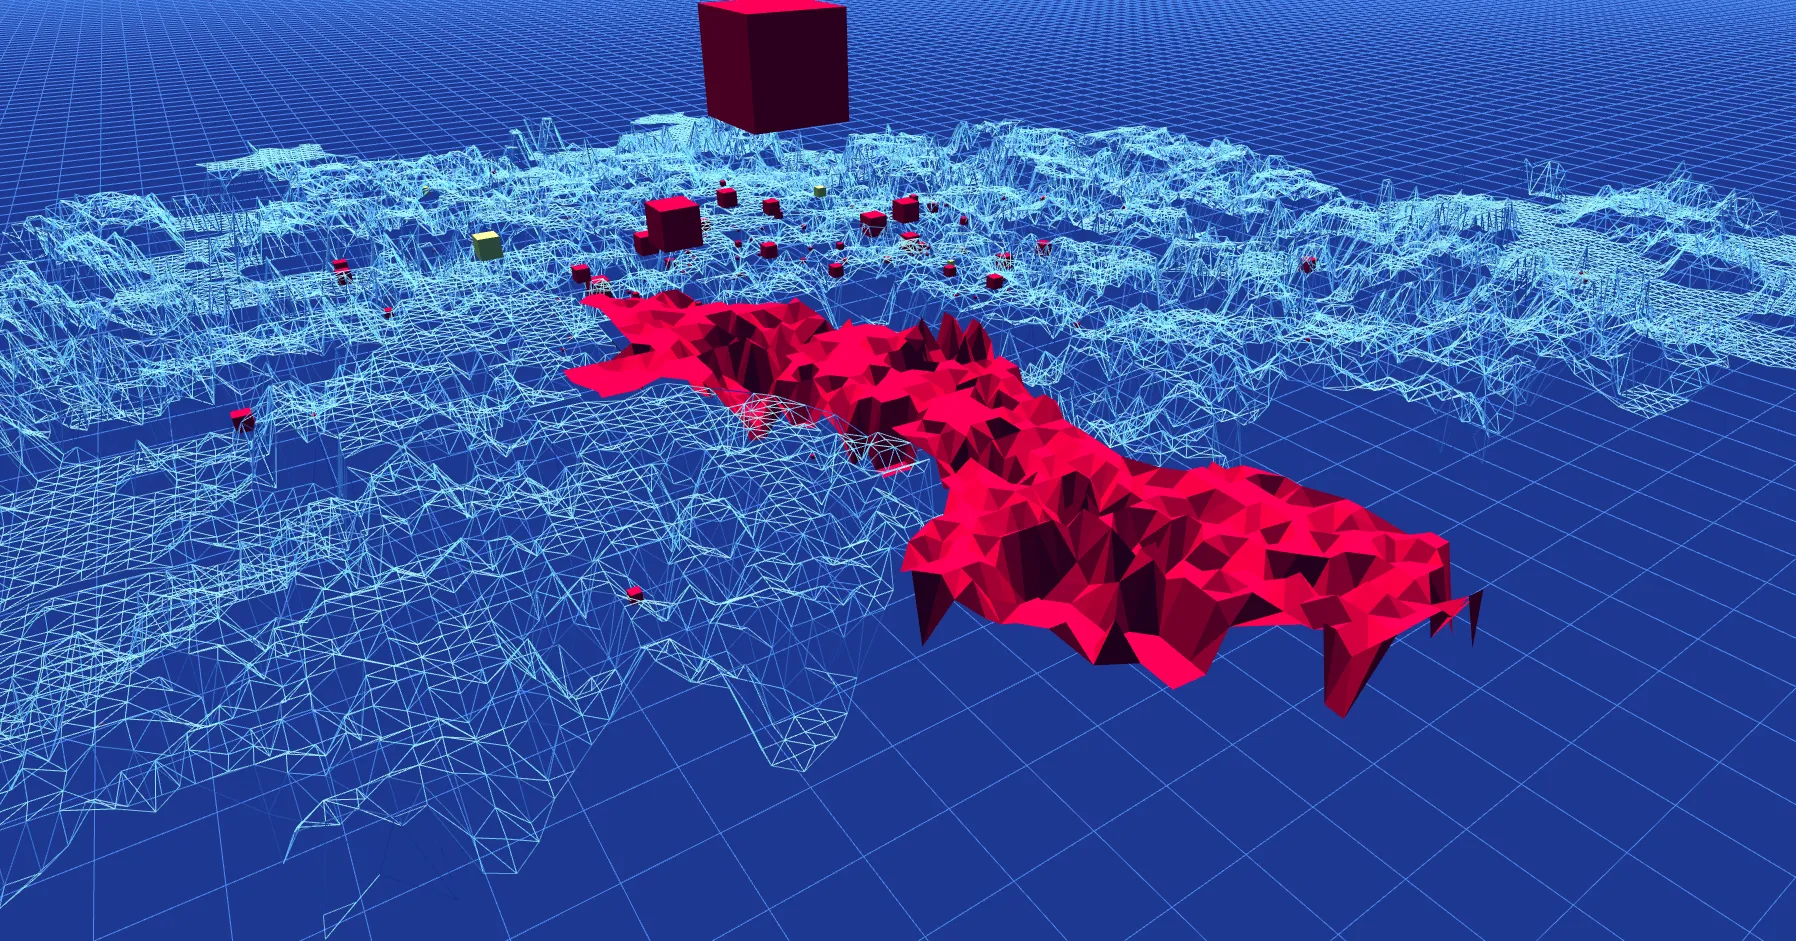
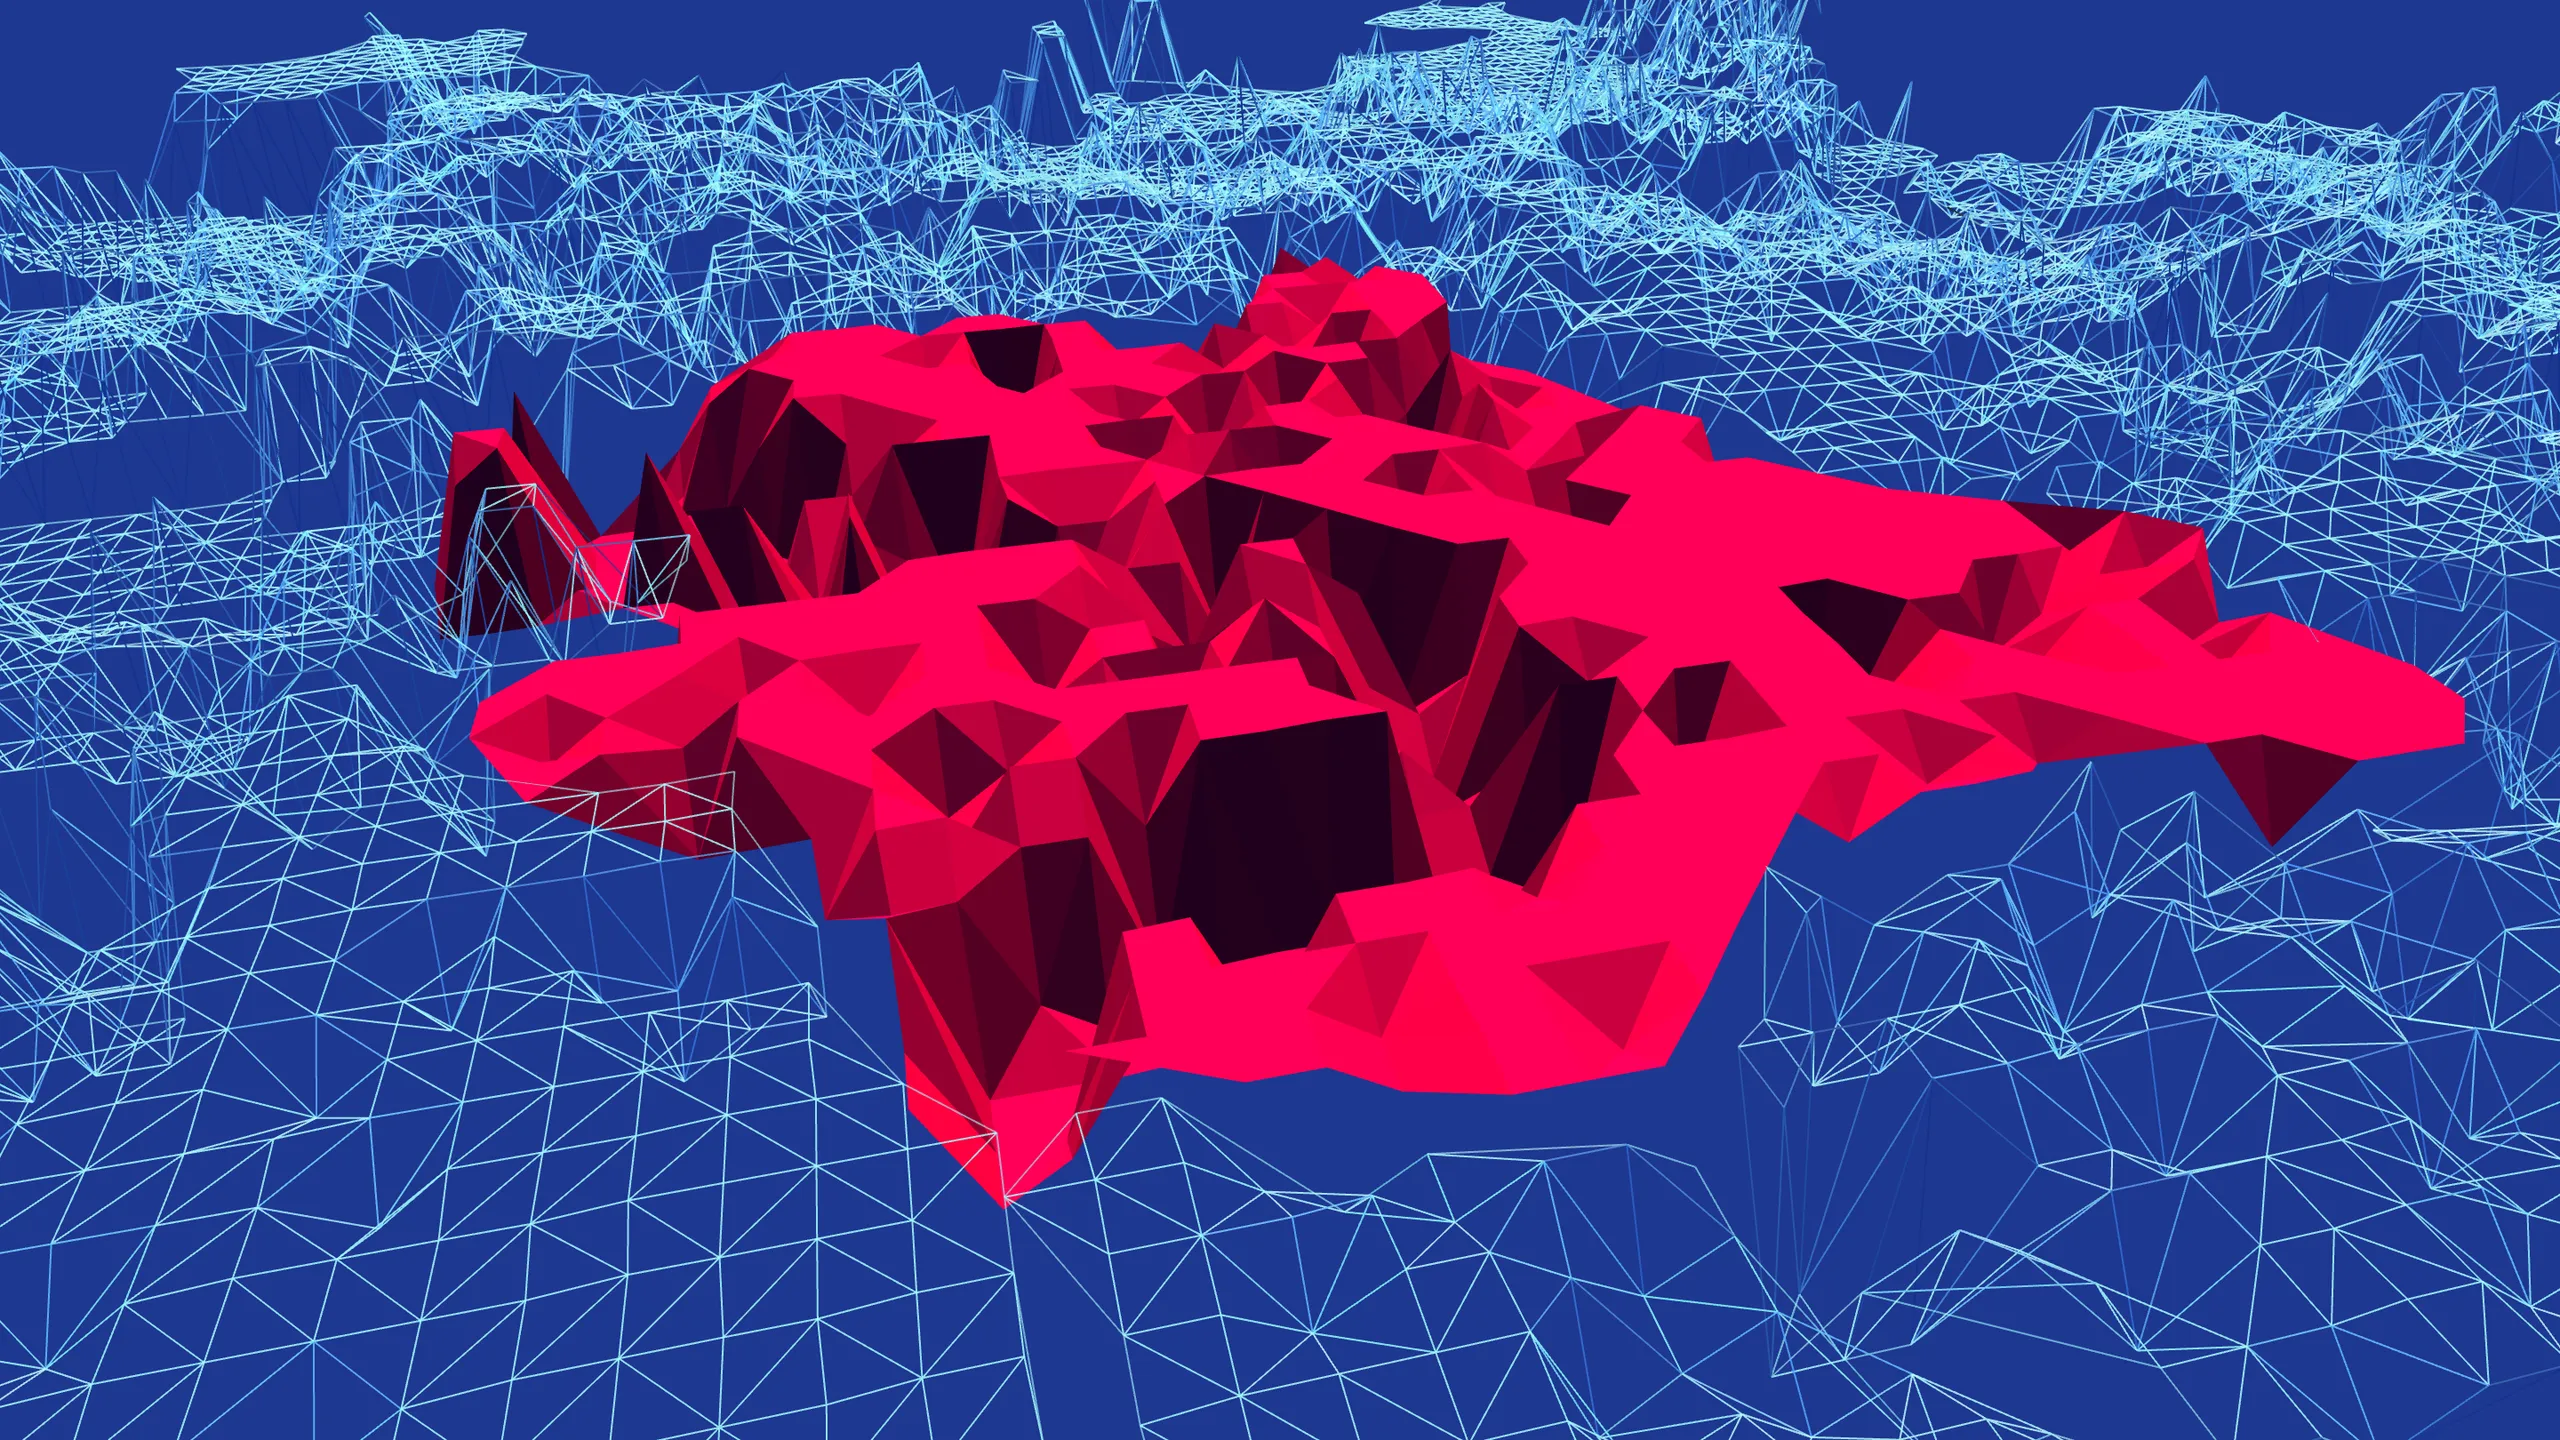
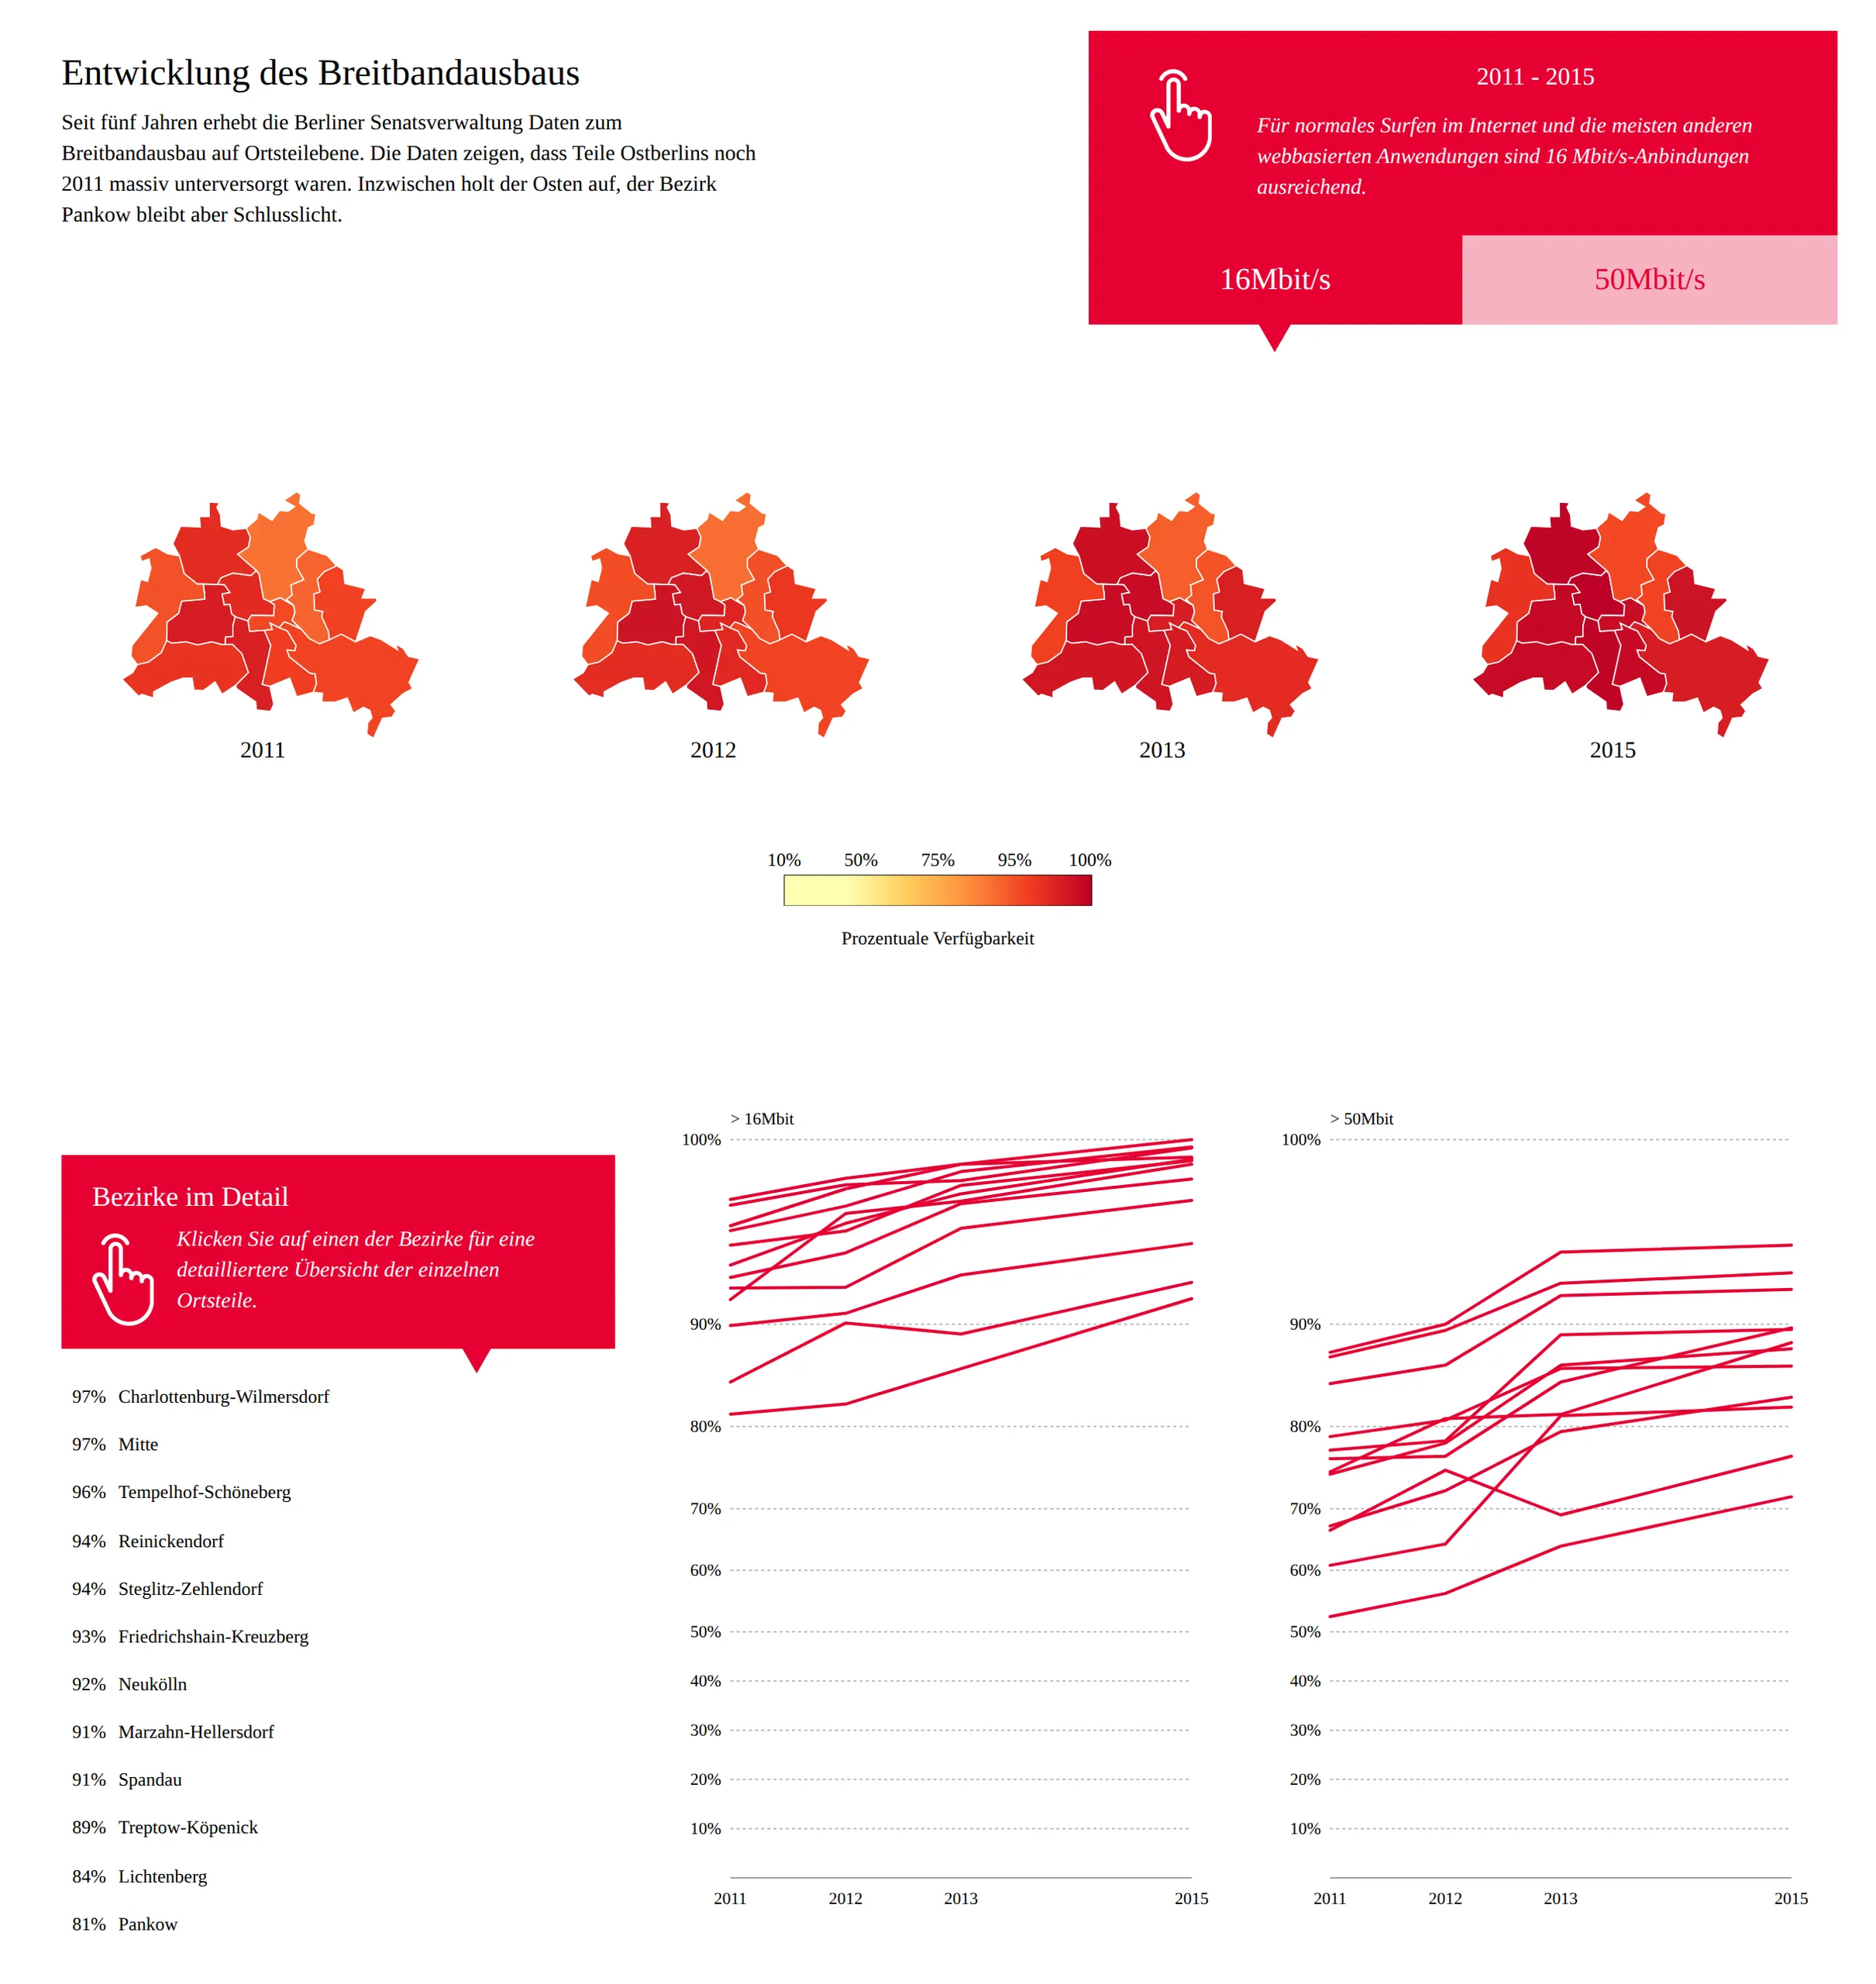
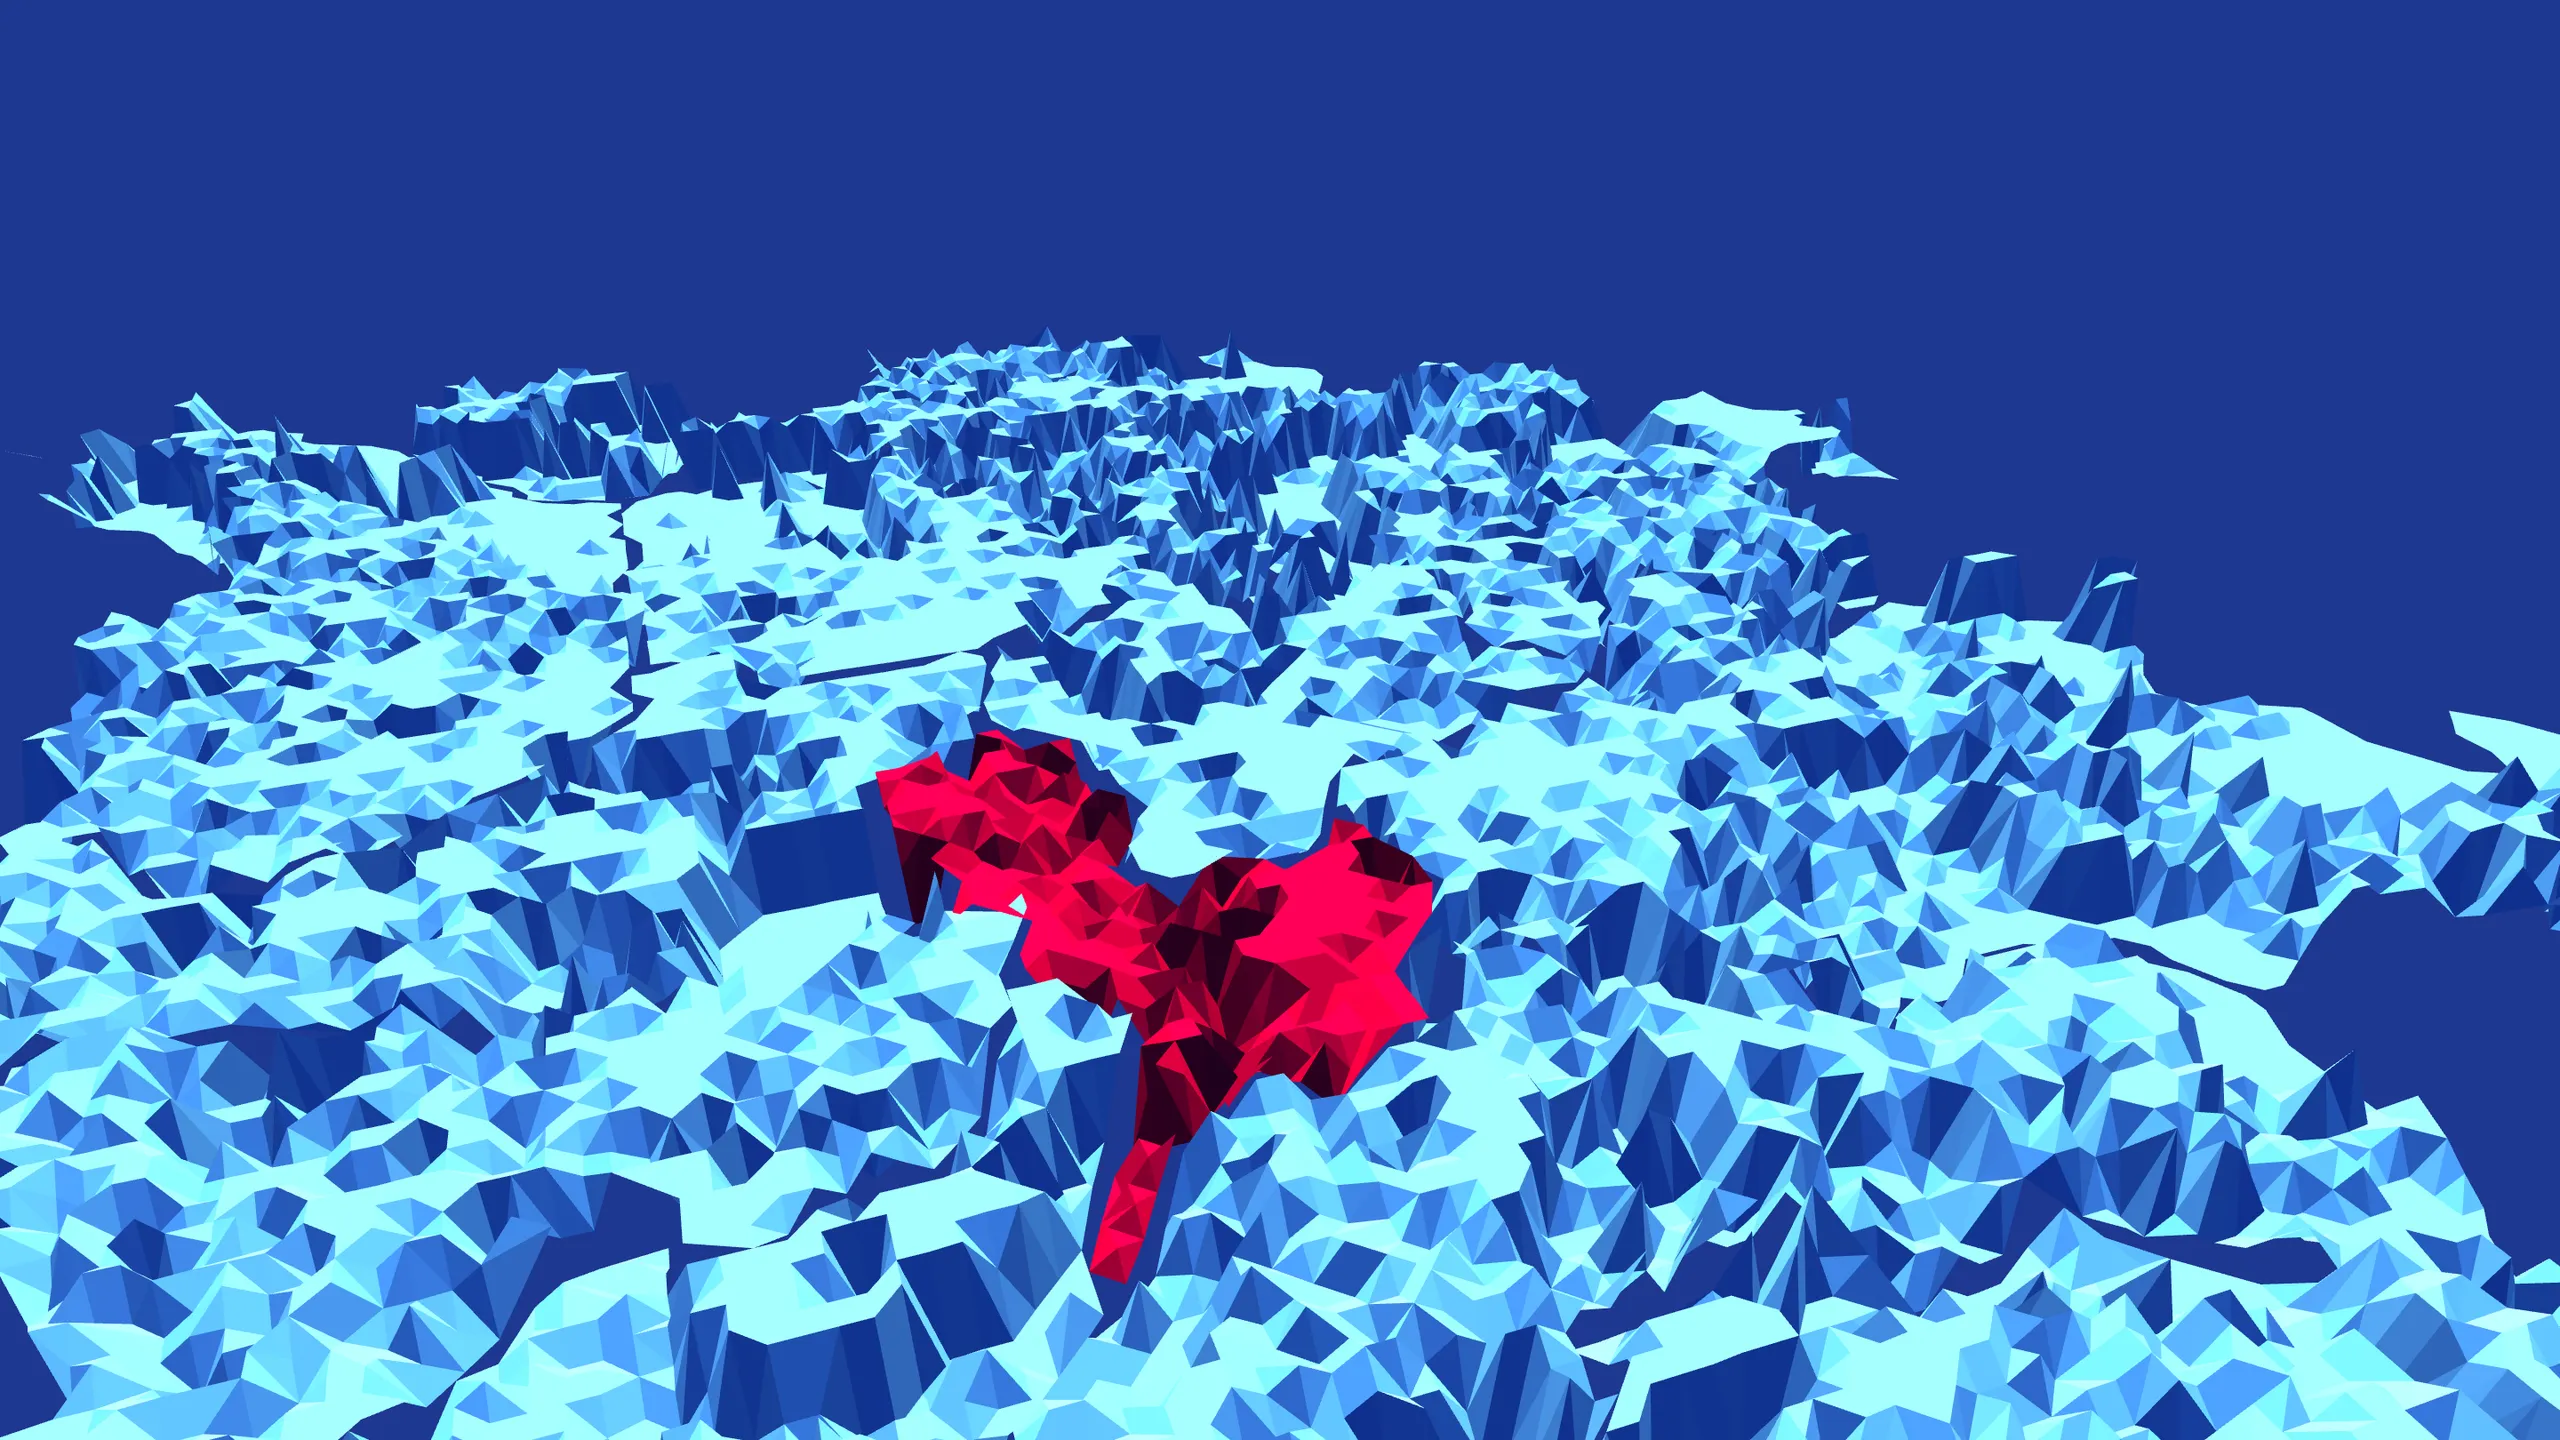
The site starts with five years of data that Berlin’s Senate administration collected for each neighborhood, 2011 to 2015: parts of East Berlin were still badly underserved in 2011 and have been catching up since, while the district of Pankow stayed last. A zoomable map follows the connections down to single building blocks. It also shows BRAIN, Berlin’s research network, which links research, cultural and educational institutions to the state-owned fiber network at up to 10 Gbit/s. Further sections explain the technologies, from DSL and cable to fiber, LTE and satellite, and which providers offer them. A section called »Puls der Stadt« (pulse of the city) sets 24 hours of Twitter and Instagram activity, mapped only coarsely for privacy, against traffic at the Berlin internet exchange BCIX. An interactive 3D view lifts the city’s twelve districts into a faceted surface whose height follows 50 Mbit/s coverage, with Twitter and Instagram activity floating above it as cubes.
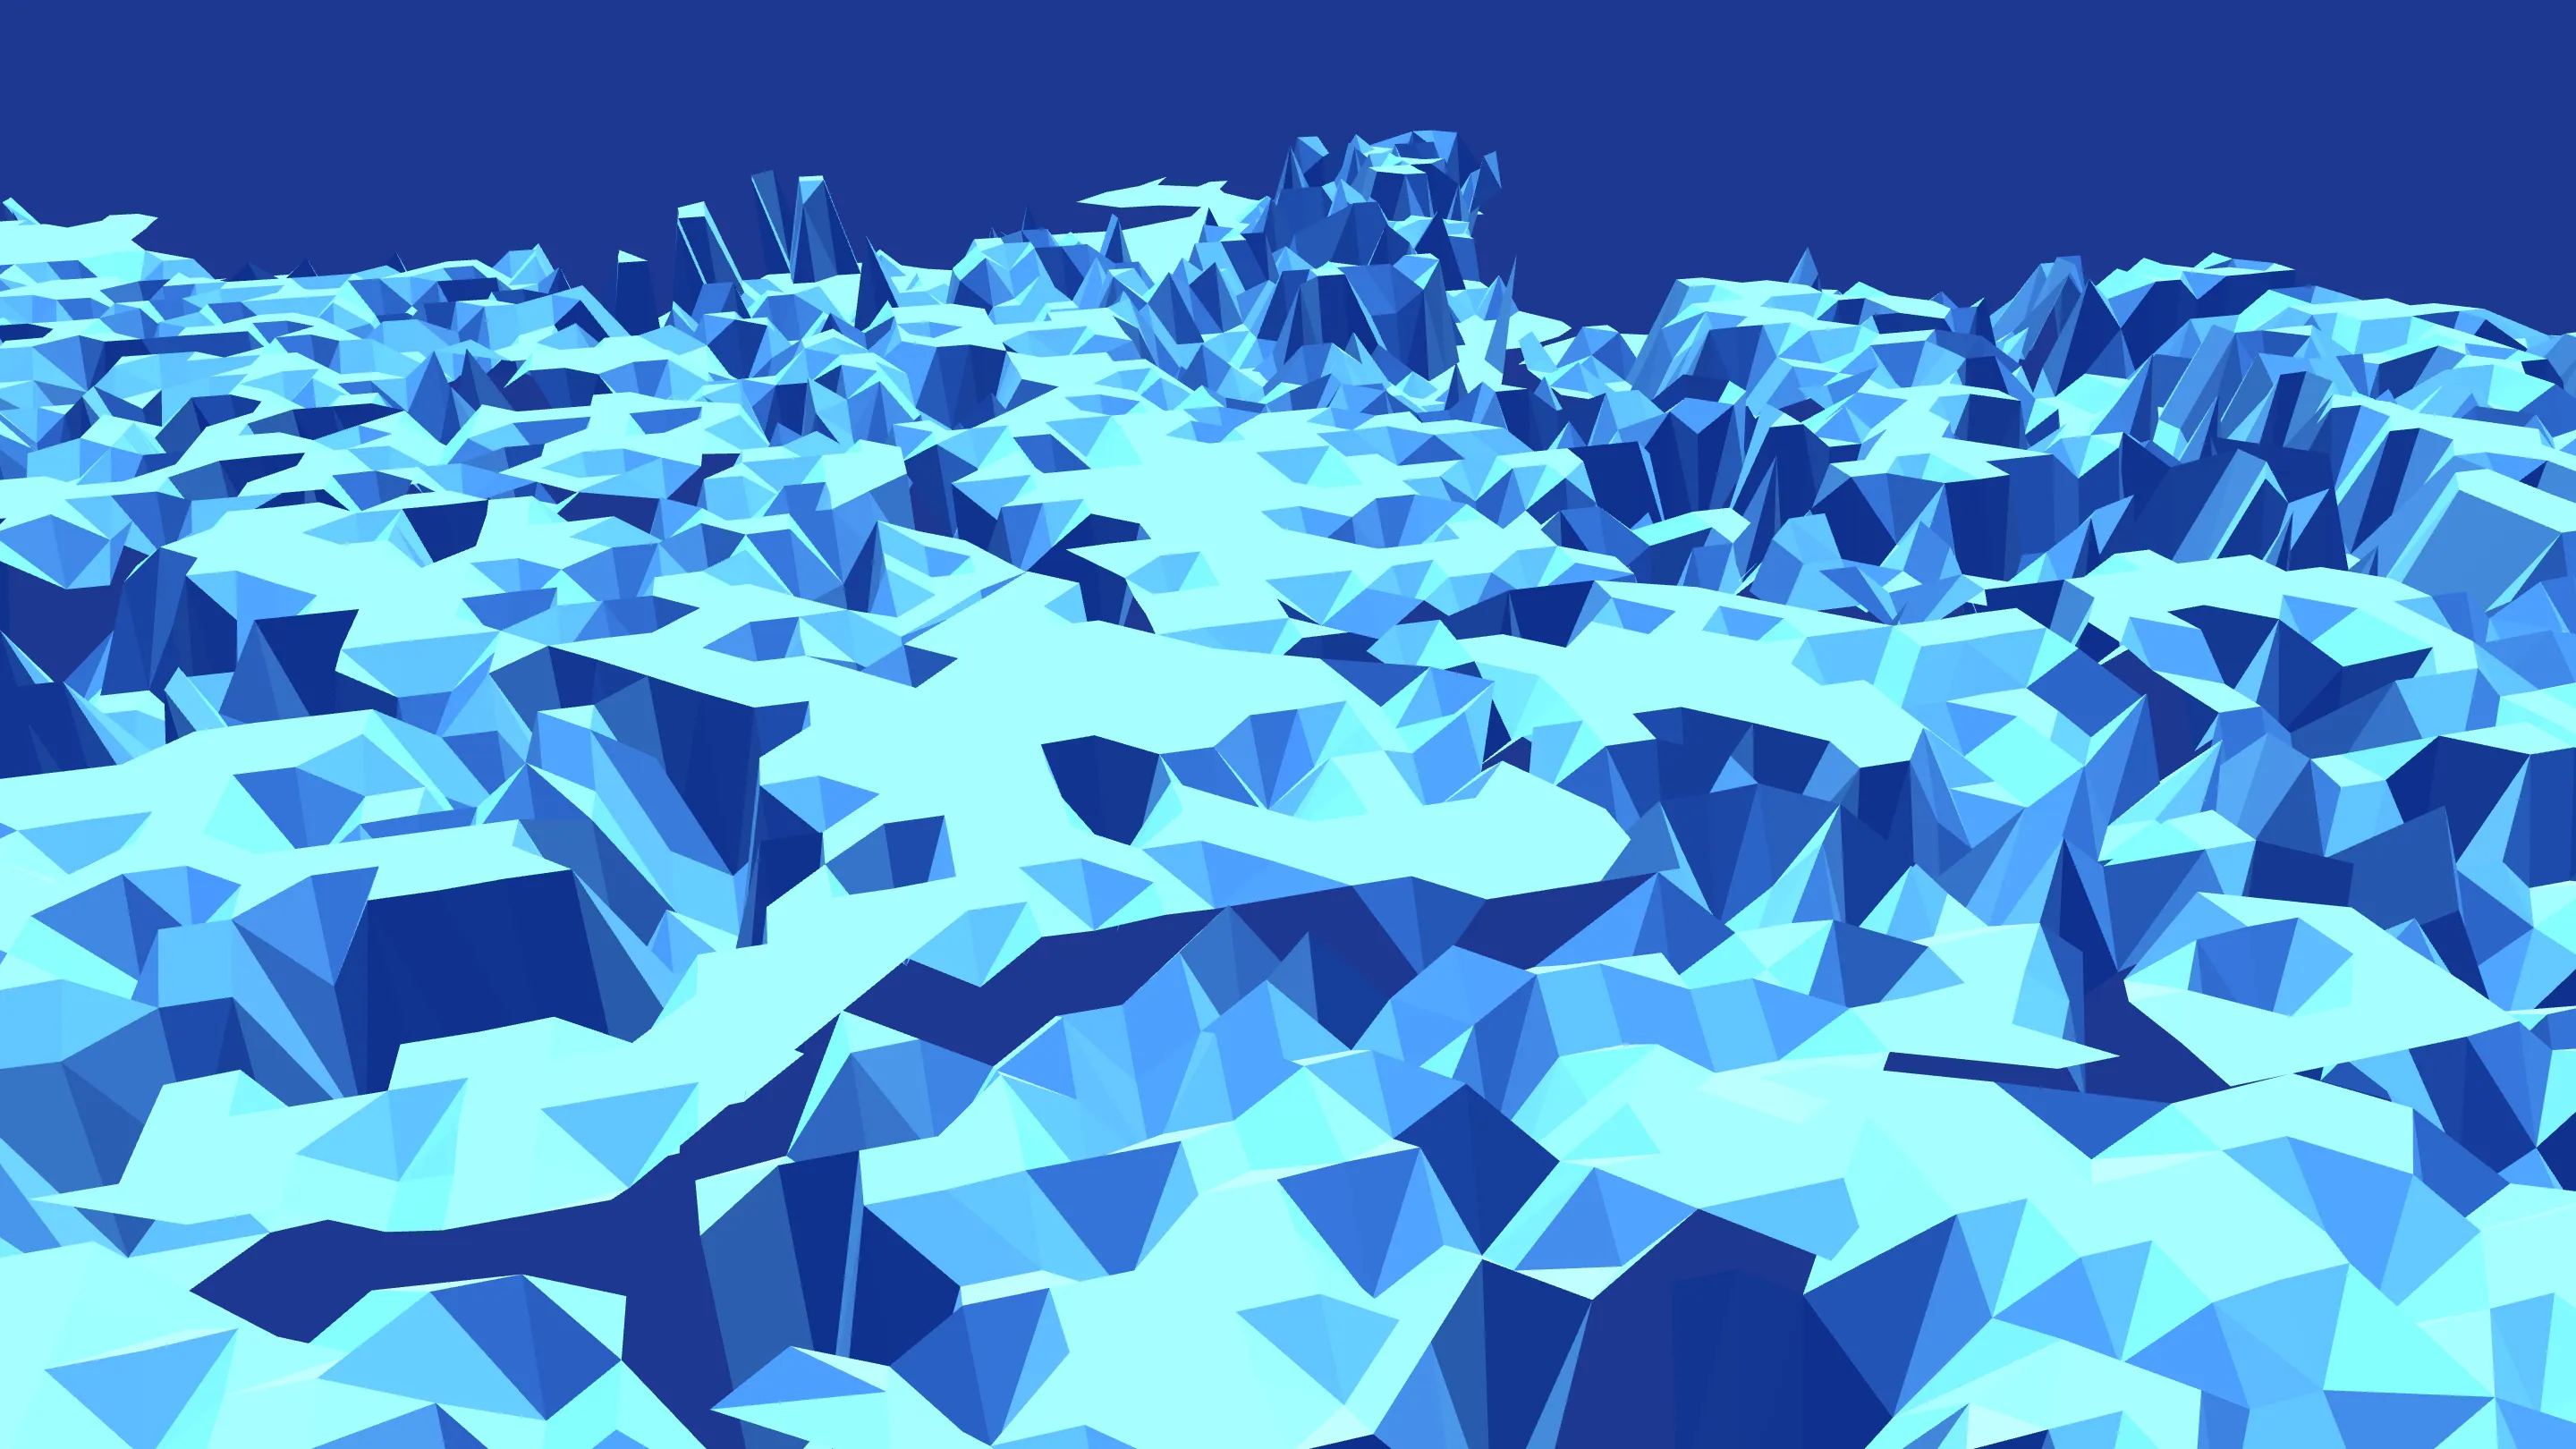
In code, my share was the 3D view, including its social-media layer, and the timeline charts. My first commit, in December 2015, was a draft of the timeline chart. The 3D view took shape over January 2016 in eighteen three.js studies: a first mesh, experiments with light, a raycaster for picking districts, and finally the social data as floating cubes.
The starting point was a detailed evaluation of broadband expansion published by the Senate Department for Economics, Technology and Research. The underlying data came from the Broadband Atlas, which TÜV Rheinland compiled for the Federal Ministry of Transport and Digital Infrastructure. The Senate’s PDFs were not machine-readable, so the data was reworked and released together with the code in Technologiestiftung’s repository. The foundation’s aim was to show that open data can lead to new projects and insights. Our development repository, including my three.js studies for the 3D view, is on GitHub. The last study still runs on GitHub Pages. A copy of the finished site is there too, but its block-level map and 3D view no longer load.
Images
Left and right arrow keys flip through the pile, Enter enlarges the top image.