NZZ Wandelhalle
An interactive network for NZZ tracing who walks the Swiss parliament's lobby — and on whose behalf.
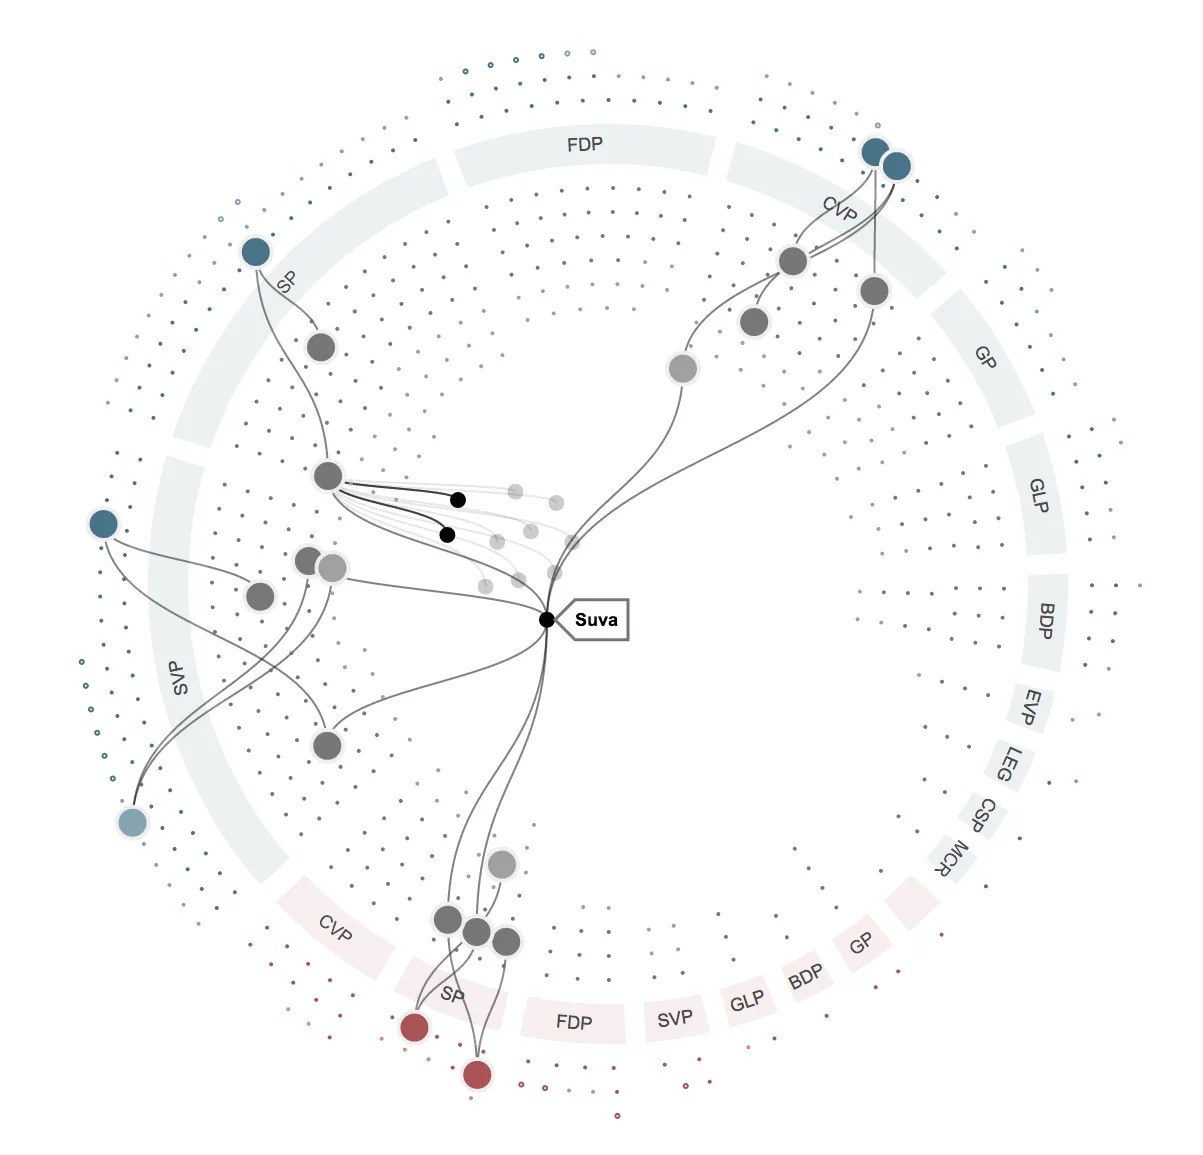
Who actually walks the lobby of the Swiss parliament? For the Swiss newspaper NZZ, I built »In der Wandelhalle«, an interactive visualization that explores the true interests of lobbyists (full article) — commissioned through OpenDataCity with data journalist Lorenz Matzat, for NZZ’s Sylke Gruhnwald. The data comes from parliament’s official lists — 244 members and the 409 people they had given permanent access badges, as of 6 February 2014 — which NZZ’s data team checked against the Swiss commercial register for the mandates and stakes behind their declared functions.
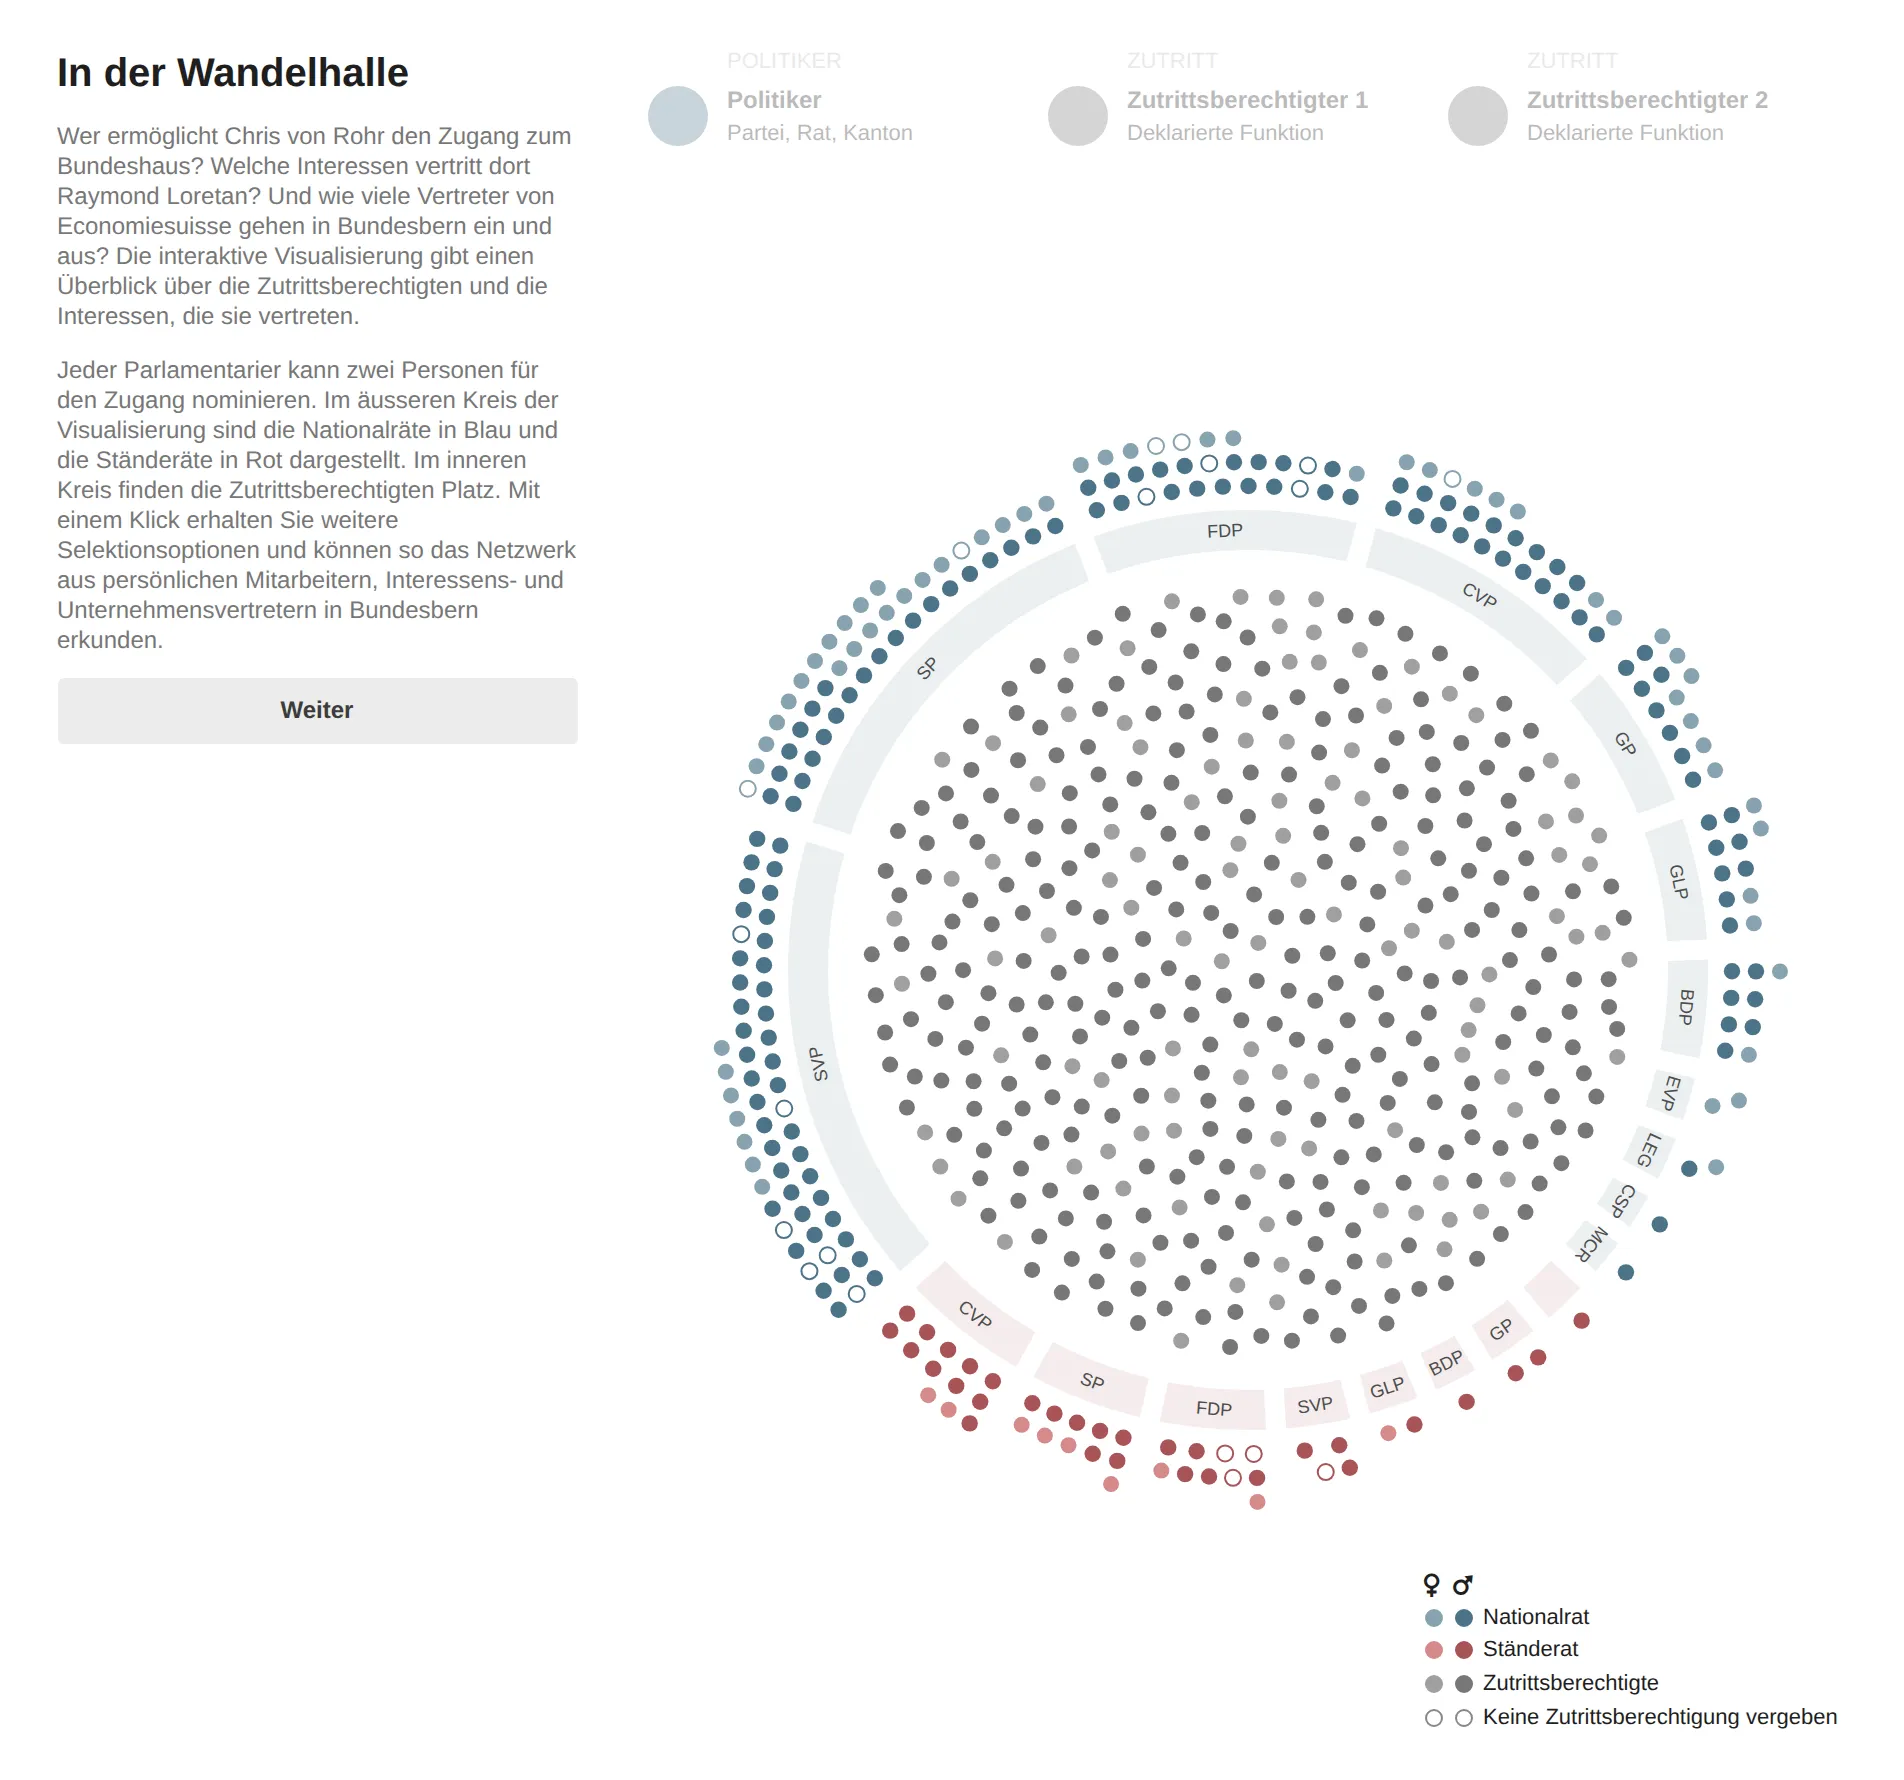
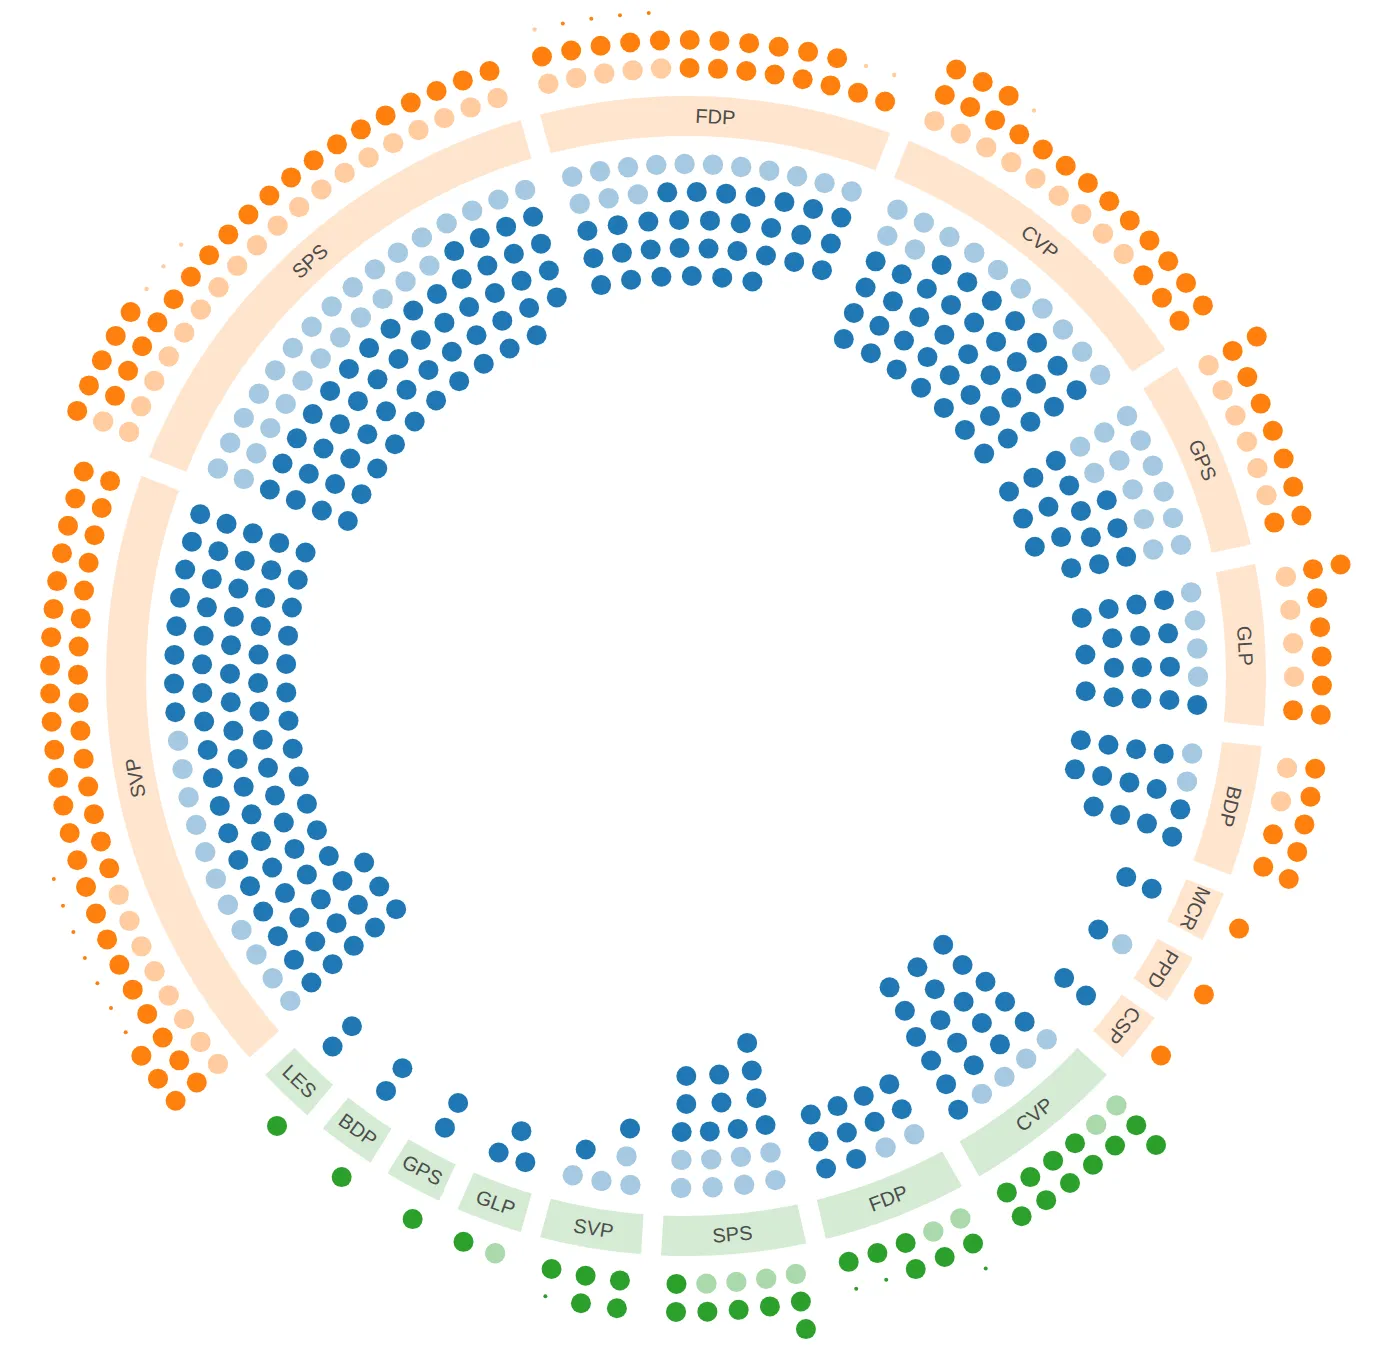
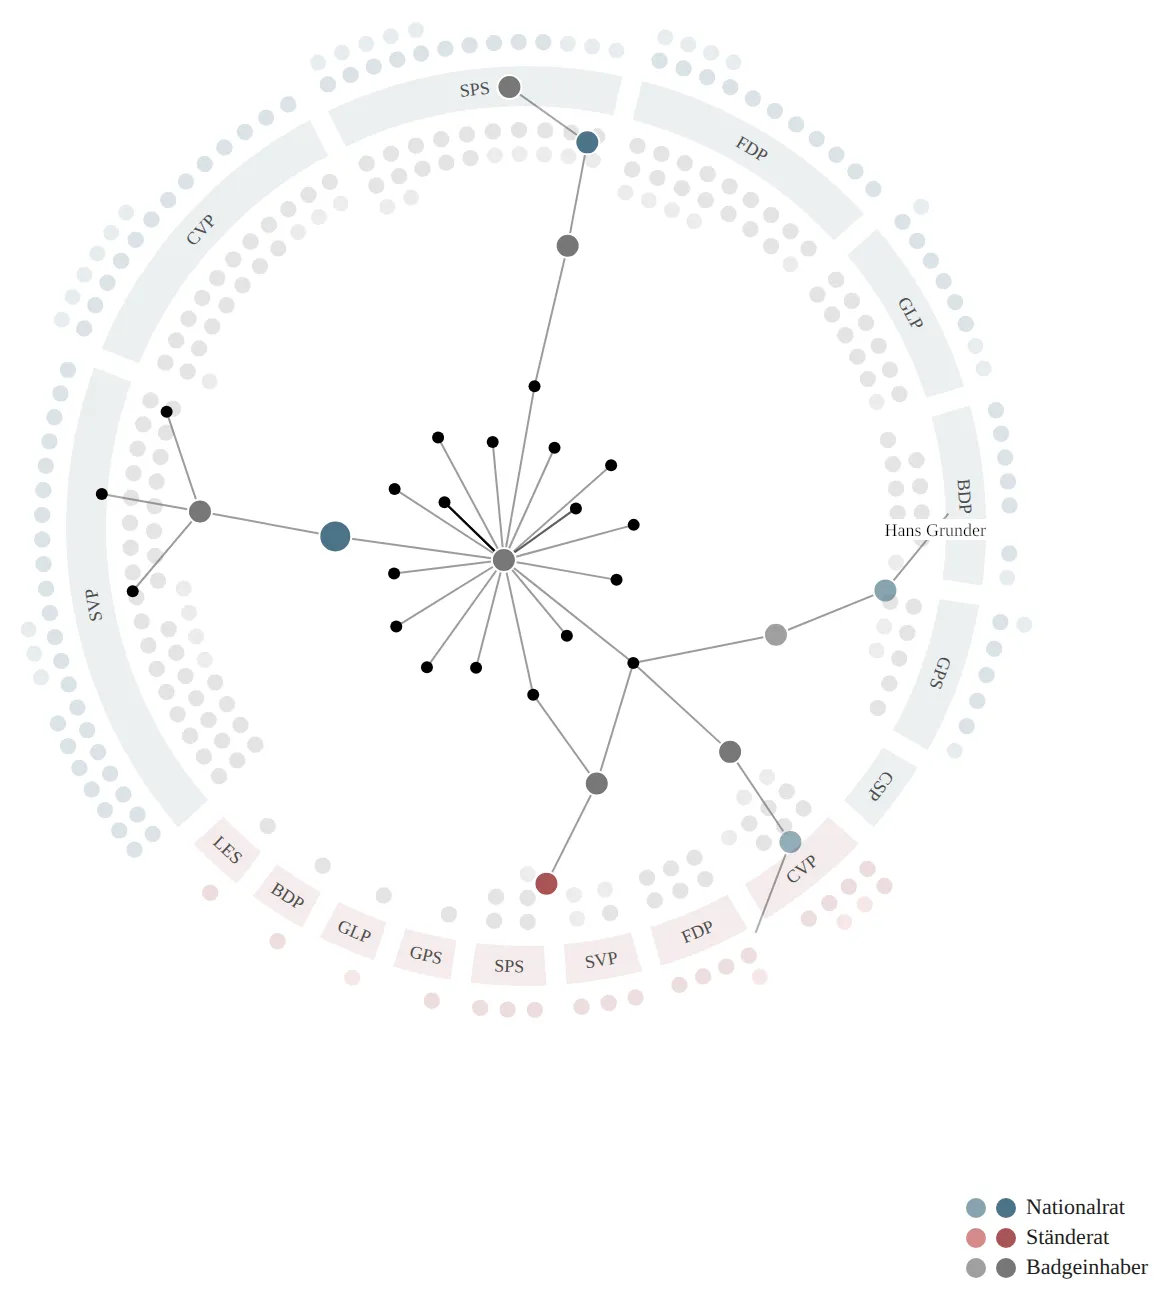
Every member of parliament may nominate two people for a permanent badge. The outer ring holds the members of the National Council in blue and of the Council of States in red, grouped by party; the badge holders fill the inner ring. Select anyone, or pick one of the prepared examples, and the network traces who gave whom access, setting each badge holder’s declared function against the further mandates and stakes the commercial register lists for them.
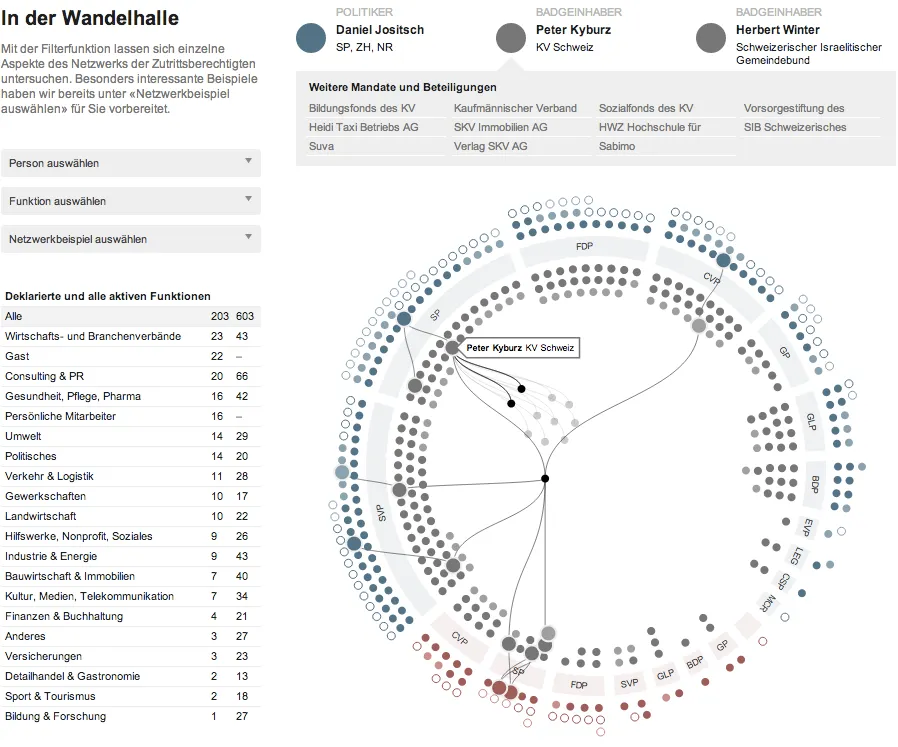
The visualization is built with d3.js. It began as a radial layout in the tradition of Mike Bostock’s examples, but over many iterations the visual language was redefined into something of its own — a playful, explorable network in which users can trace who is connected to whom, and on whose behalf.
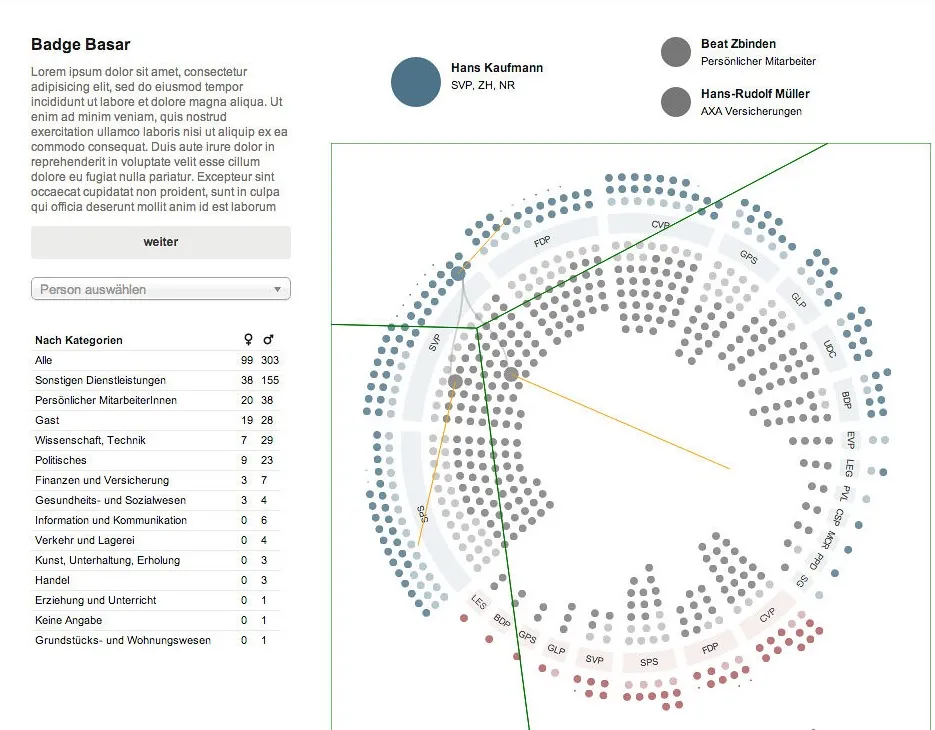
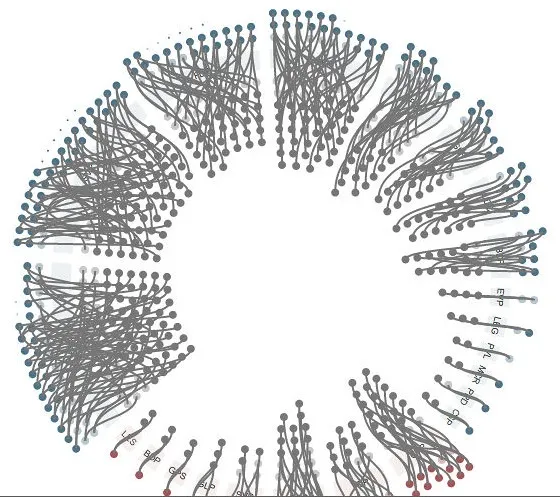
The project went through an unusually visible design process. I documented the iterations in a Flickr stream and kept some fifty prototypes online, going back to October 2013 — among them a variant with the ring in party colors and an experimental graph-view transformation that hints where the form could go next. Their source, together with the data-prep scripts, is in a process repository, and the production code is public too. Once the visualization was finished, I handed it over to Interactive Things, who made minor changes and data corrections and deployed it to AWS.
Six years later, Lorenz Matzat and I came back to lobbying with an explorable map of Germany’s financial lobby for Finanzwende.
Images
Left and right arrow keys flip through the pile, Enter enlarges the top image.