Deep Sweep Visualization
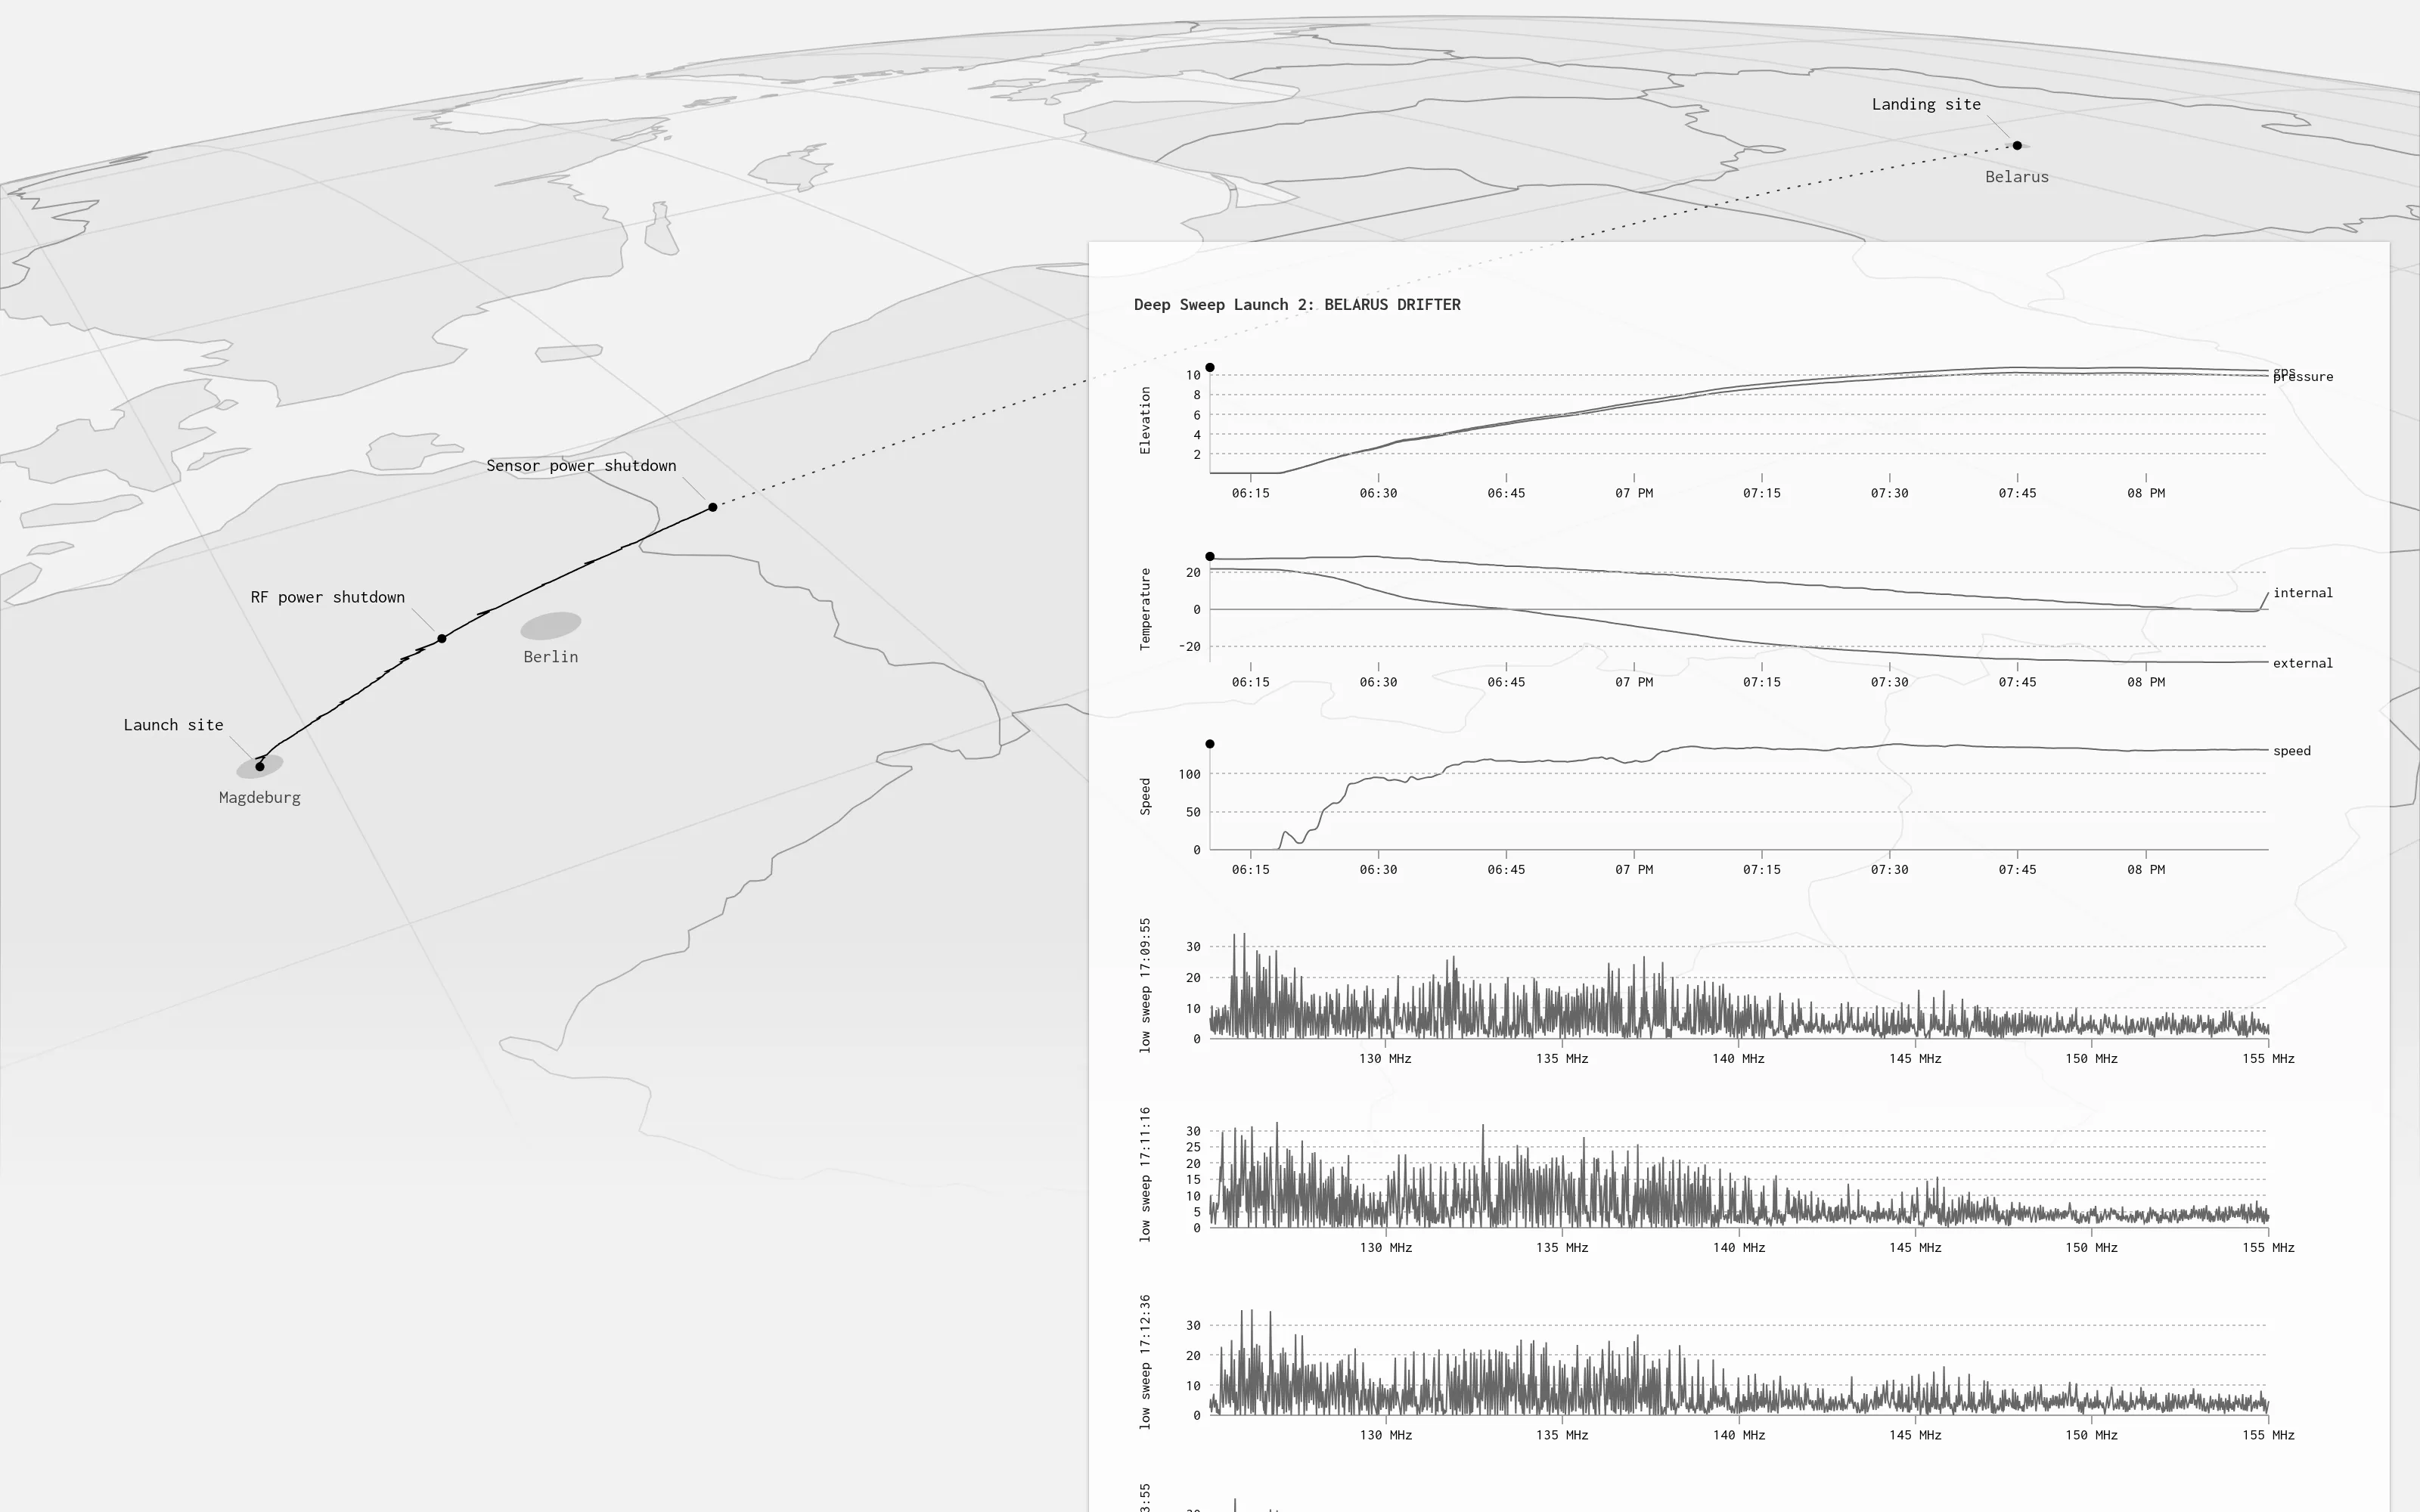
An interactive flight record for The Deep Sweep, plotting the GPS trace, sensor readings and radio sweeps that a signal-scanning weather balloon logged on a flight that drifted more than 1,000 km from Magdeburg to Belarus.
The Deep Sweep is a 2015 work by the Critical Engineering Working Group (Julian Oliver, Bengt Sjölen and Danja Vasiliev). It is an aerospace probe, in the form of a high-altitude weather balloon carrying a tiny embedded computer and RF equipment, that scans the otherwise out-of-reach signal space between land and stratosphere, with special interest in drone-to-satellite communication. No collected data is sent mid-flight; it is extracted from the probe once it is found. Its second launch, “Belarus Drifter”, rose from Magdeburg in the early evening of August 27, 2015. Every flight prediction had it landing near the Polish border; instead it settled in a corn field near Minsk, more than 1,000 km away, where a recovery team in Belarus retrieved it.
Julian Oliver asked me to make the visualization of the recovered data, plotting the GPS trace, sensor and RF logs. A tilted, satellite-like view of Germany, Poland and Belarus follows the route out of Magdeburg; it was inspired by Jason Davies’ satellite projection. The launch site, the landing site and the moments the sensor and RF power gave out are marked on the map. Beside it, charts plot altitude, temperature and speed over time, along with the radio sweeps across the LF/HF, UHF and SHF bands the probe scanned.
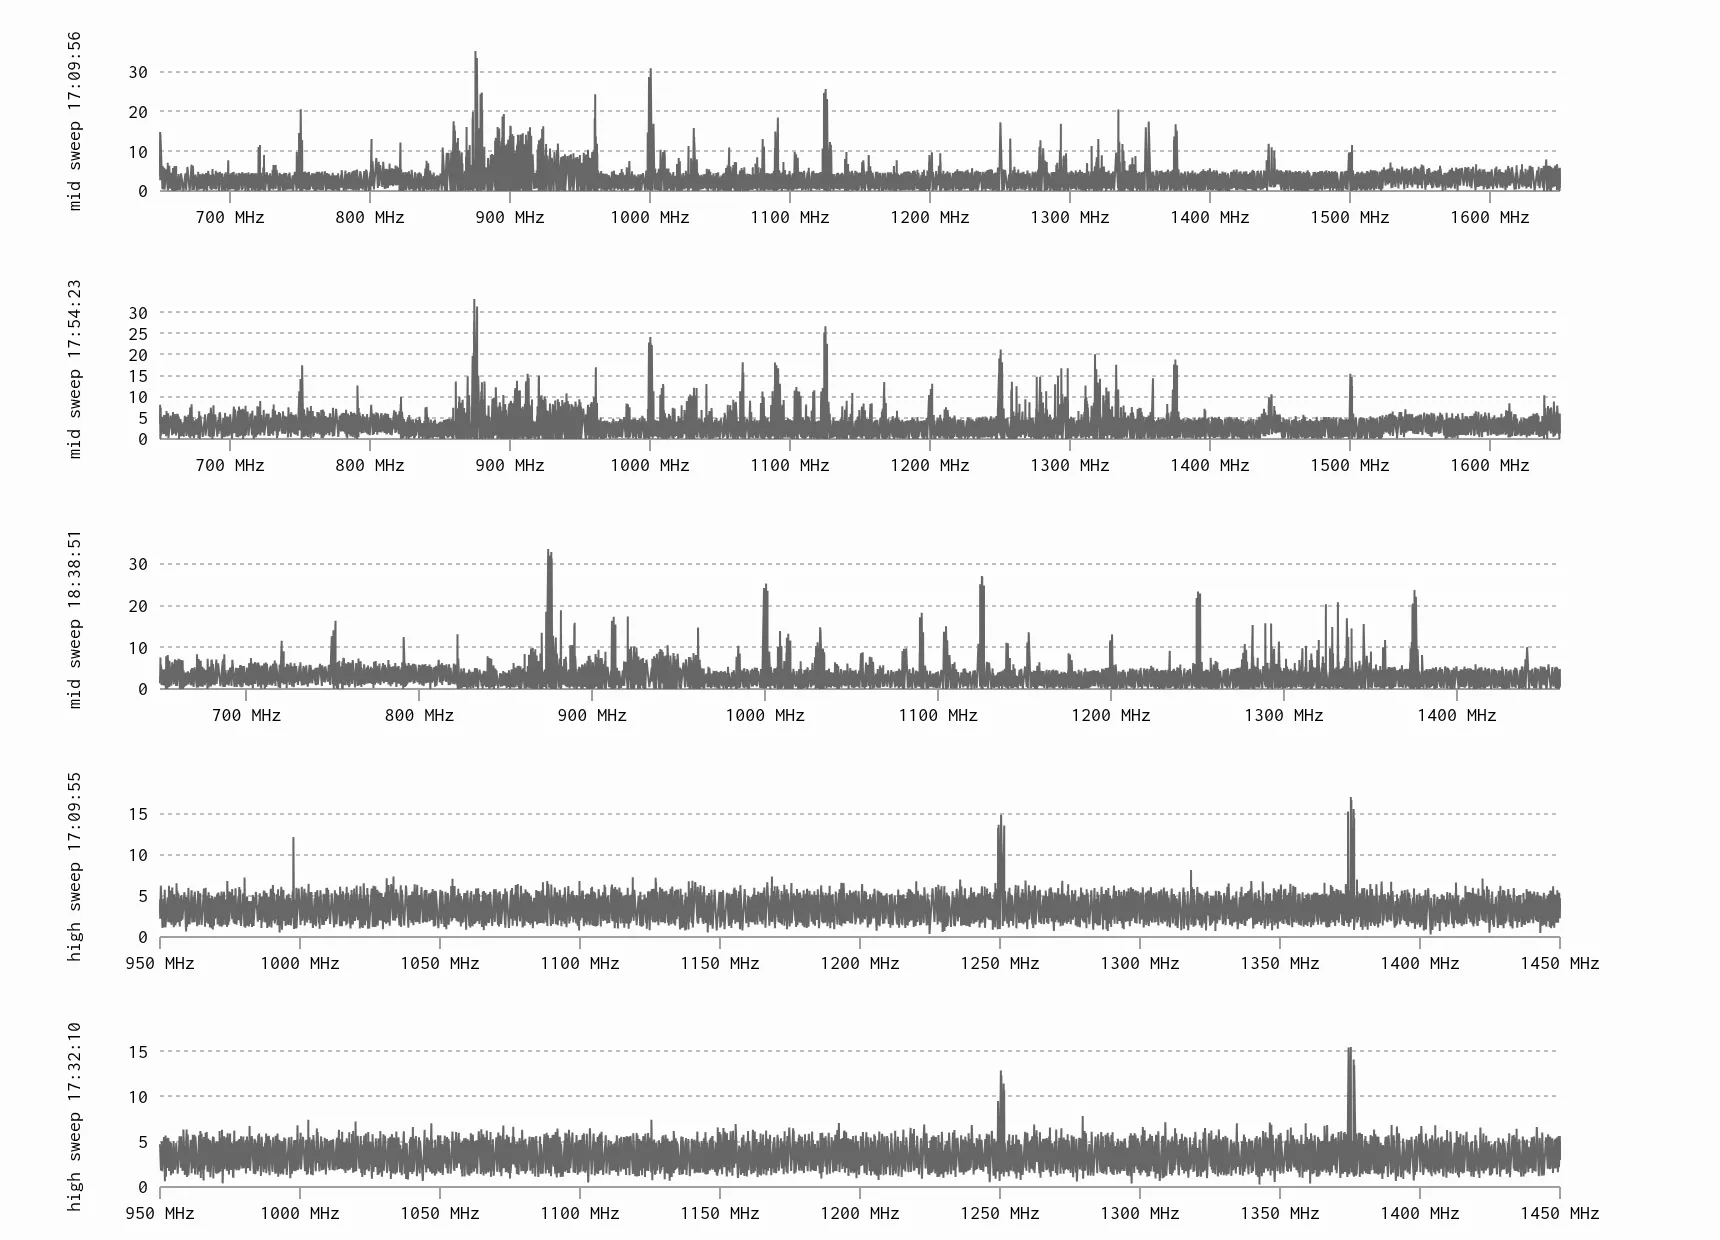
The Working Group’s project page shows a screenshot of the visualization, right after a download of the raw sensor and RF logs. The visualization is still online, and the code is open source on GitHub. Julian Oliver and I had worked together on Border Bumping three years earlier, and we teamed up again for HARVEST Visualization in 2017.