Code RED DNA
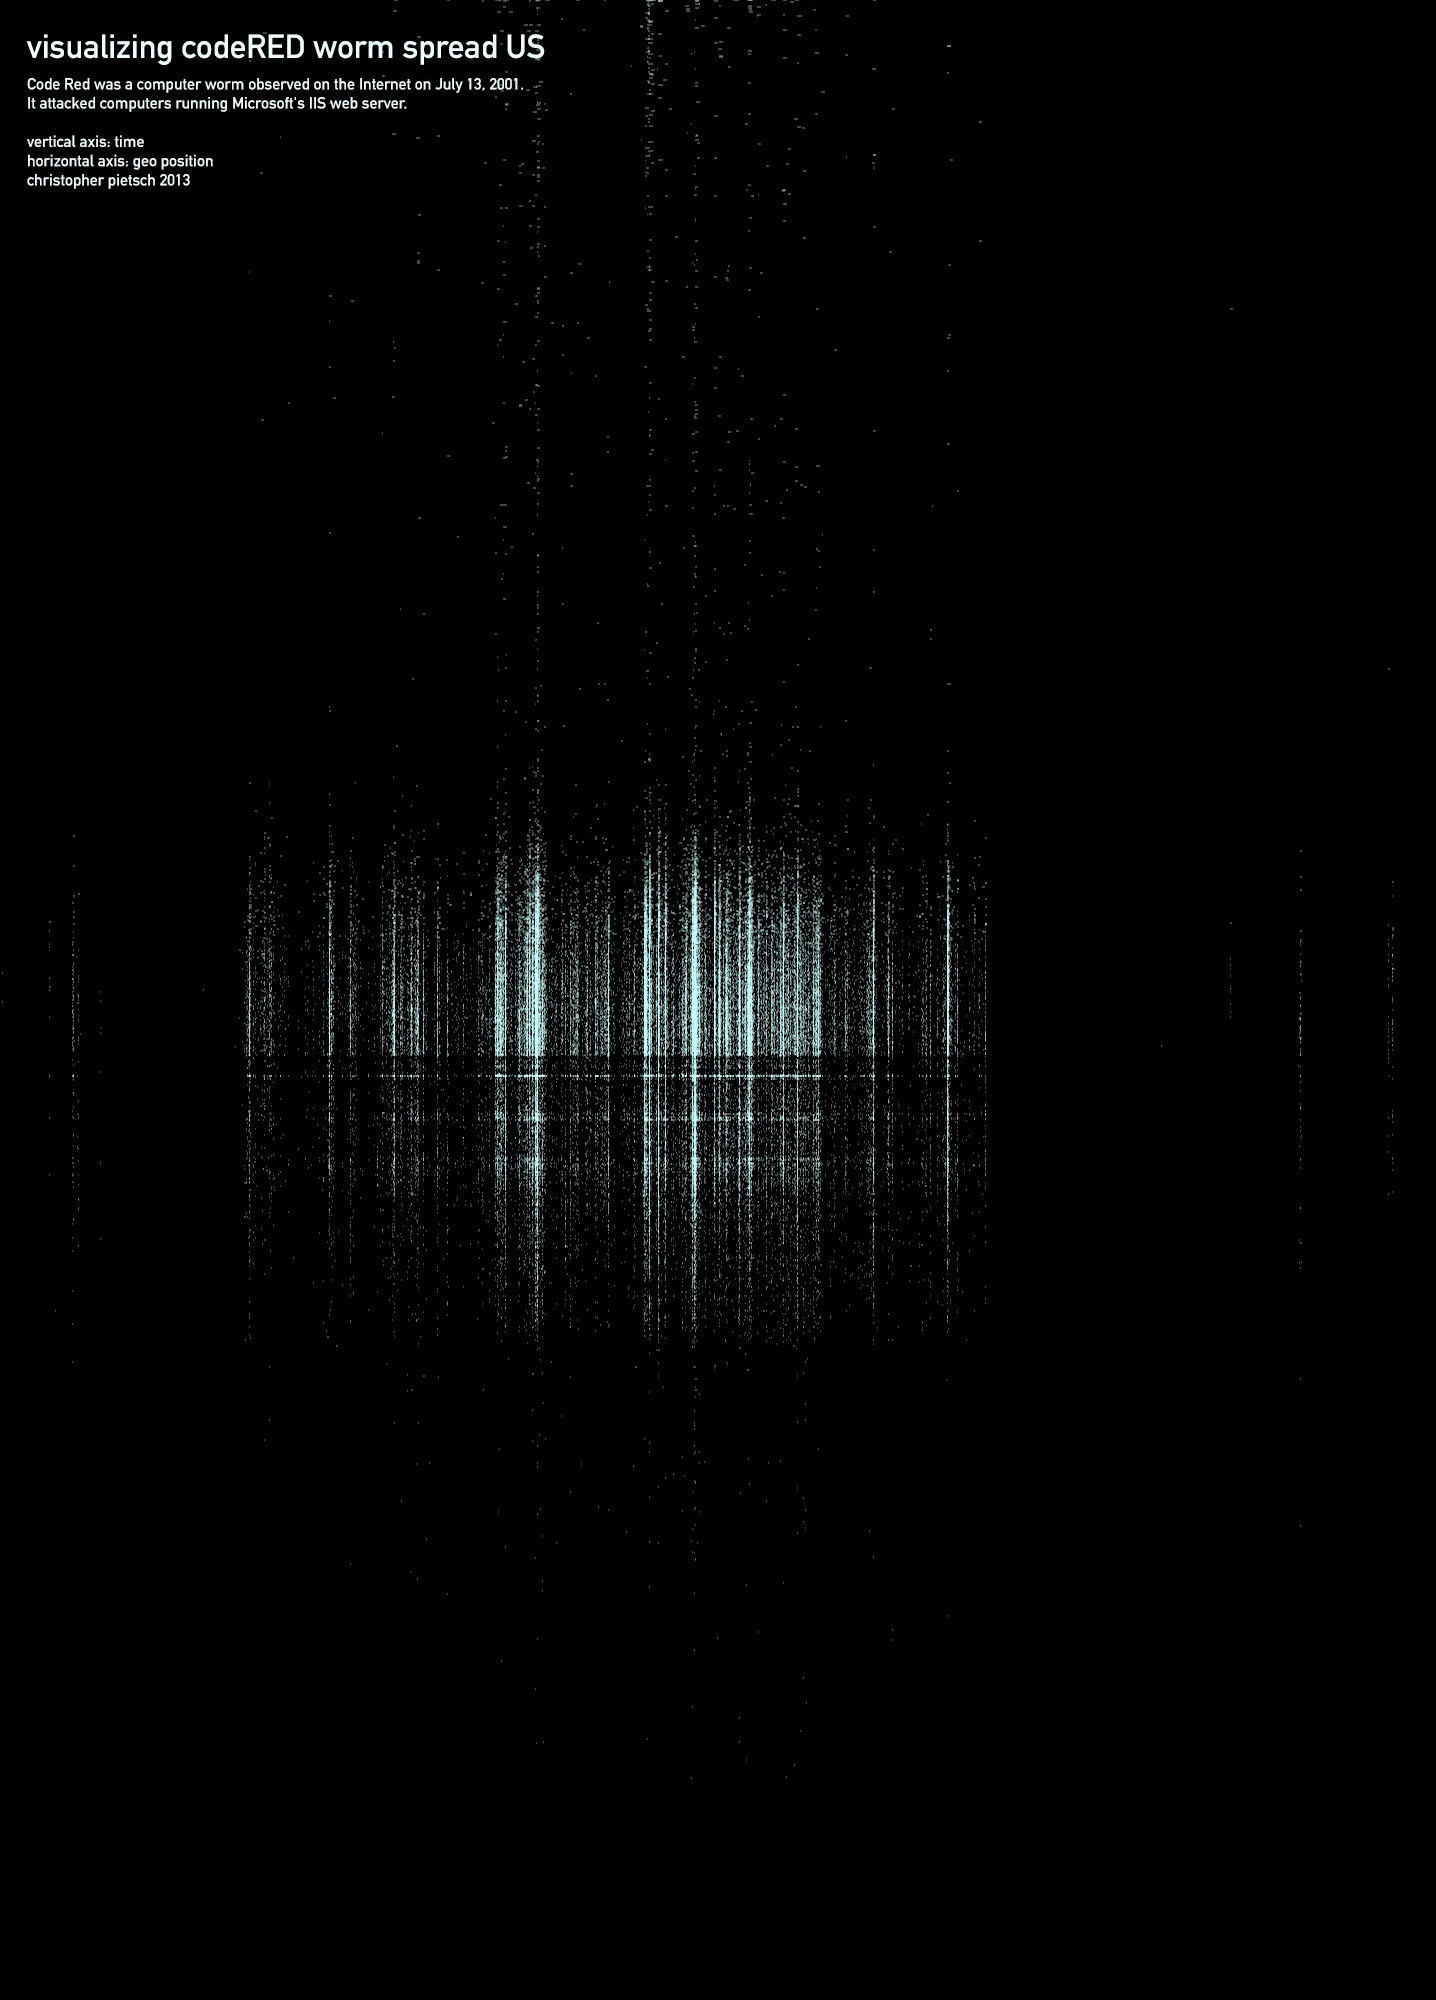
Two posters and a browser prototype that draw the Code Red worm outbreak of July 19, 2001 as streaks of light, with time running down the page and geo-position across.
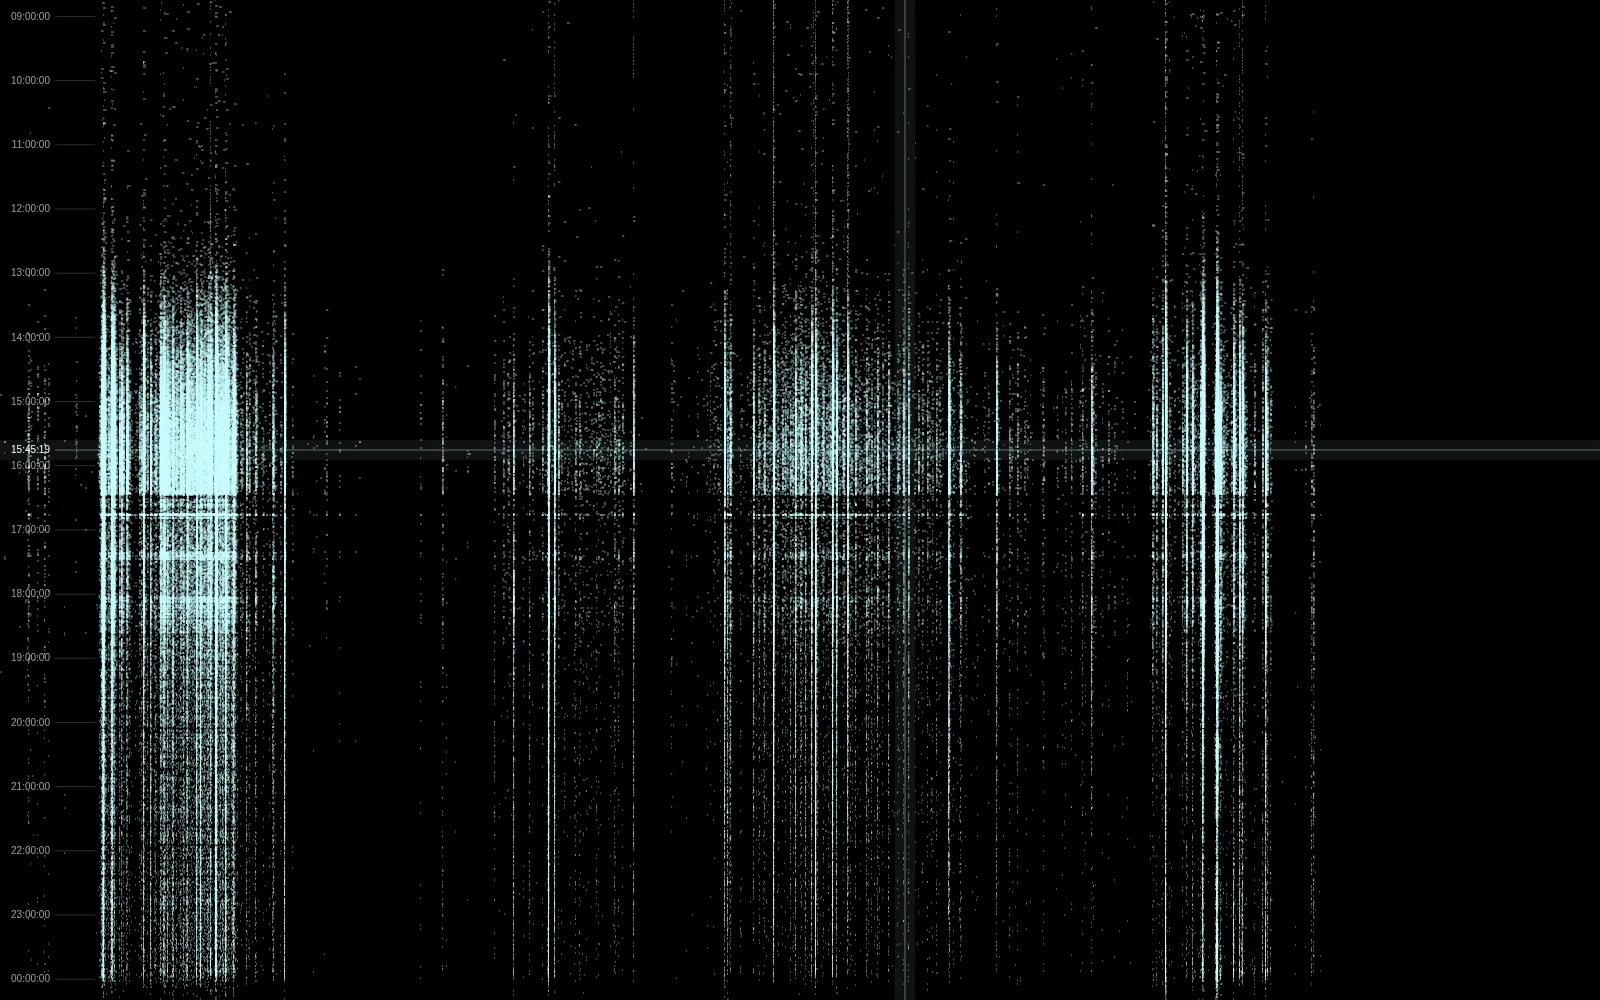
Code RED DNA plots one day of an internet epidemic. Code Red was a computer worm that attacked computers running Microsoft’s IIS web server. The table behind this piece, from CAIDA’s Code-Red worm dataset, follows its spread on July 19, 2001: 359,104 infected hosts, with columns for each one’s start and end time, country, latitude and longitude, and network. Time runs down the page and geo-position runs across, so every host becomes a short stroke of light, and places with many infected machines stack up into bright vertical streaks.
The name comes from what I was after: a fingerprint of how the worm moved through the infected hosts. I wanted to see everything at once, so one axis holds time and the other the categories that might matter, and with everything visible, patterns start to emerge.
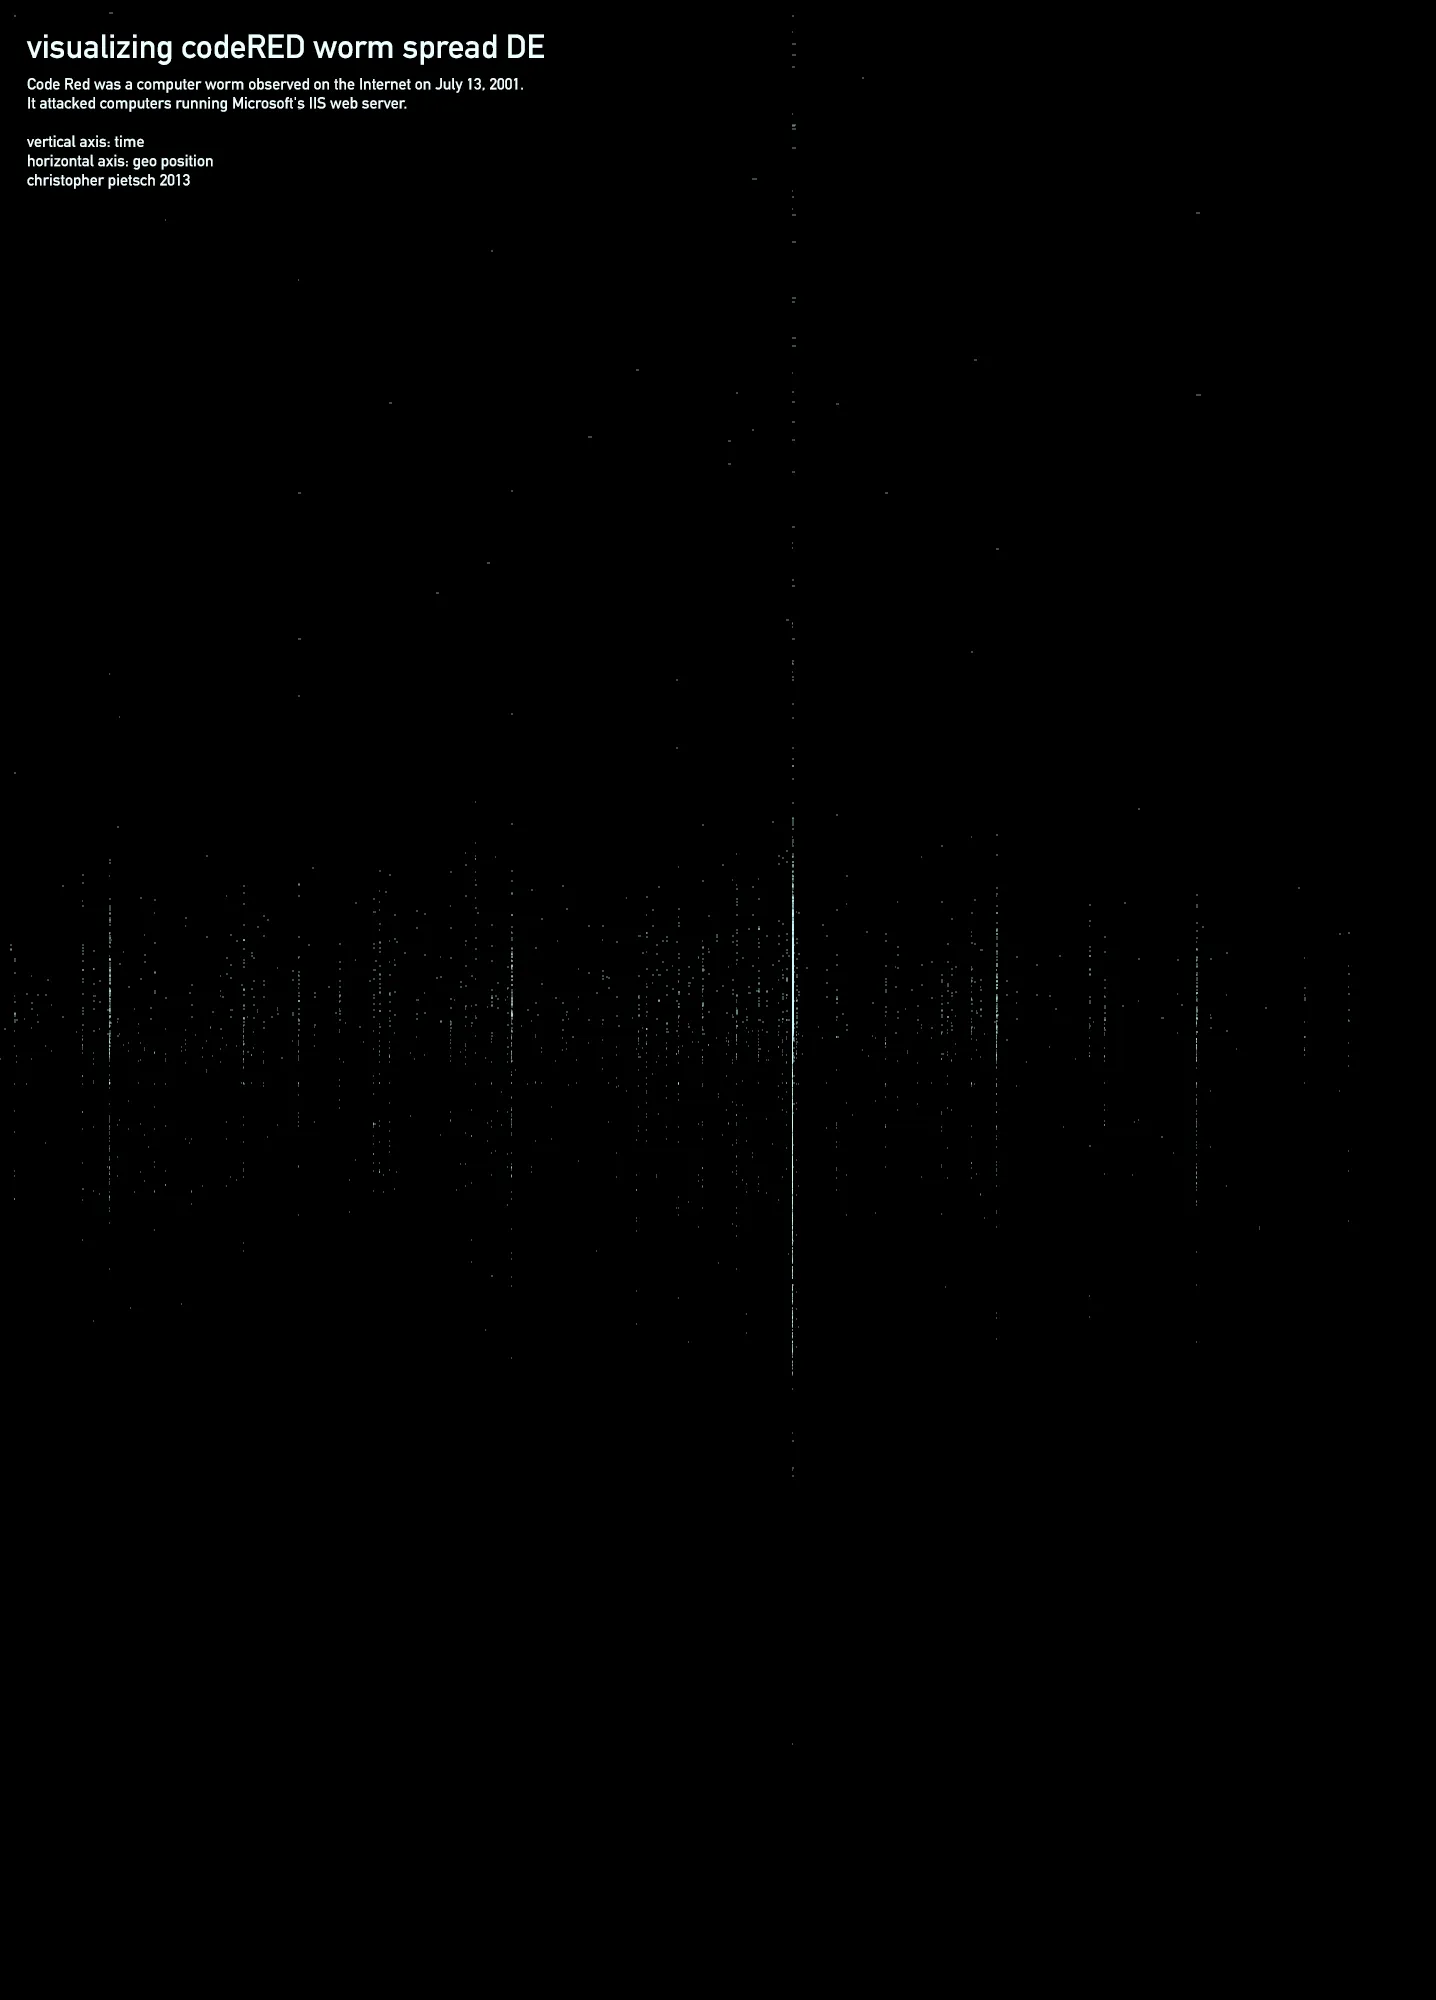
I finished it as two posters, one for the US and one for Germany. In the US poster, hours of near-silence fill the top, and the outbreak arrives as a dense band of streaks in the middle. The whole table has the same shape: a few hundred hosts an hour until noon UTC, more than 100,000 between 15:00 and 16:00, then a long fade that all but stops at midnight. The German poster is nearly empty by comparison. Its data holds 11,762 hosts, and seven in ten of them sit at one coordinate in the middle of the country (51.5° N, 10.5° E), which draws its single bright line.
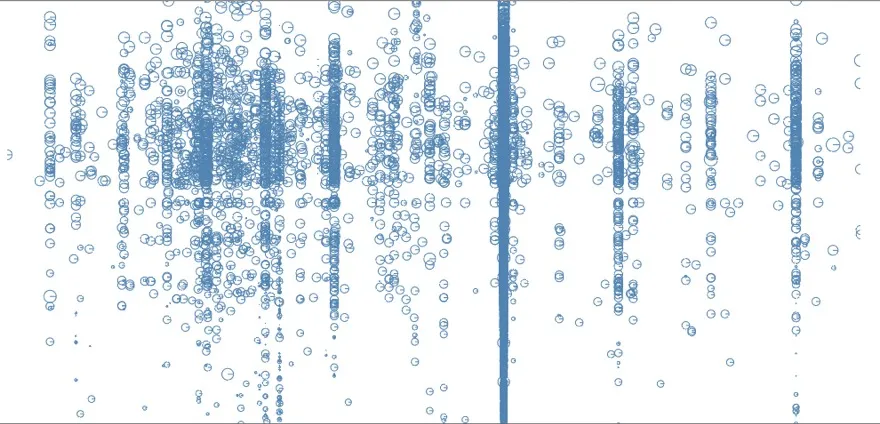
I worked it out in the browser, in ten numbered test files. A comment in the first ones still reads »ruff sketch der zeigt wie man ne ganze menge auf den canvas per d3 malen kann« (a rough sketch of how to paint a whole lot onto a canvas with D3). An early version drew open blue circles on white; the later ones are light on black, with a crosshair that reads out the time under the mouse.
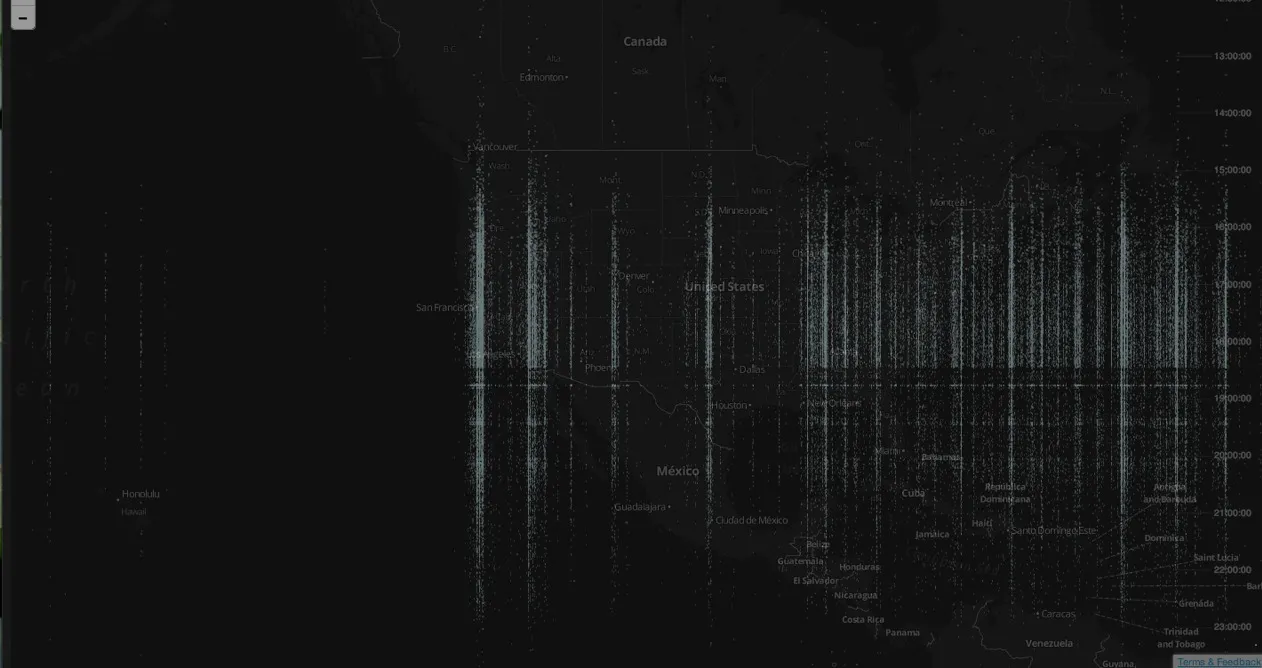
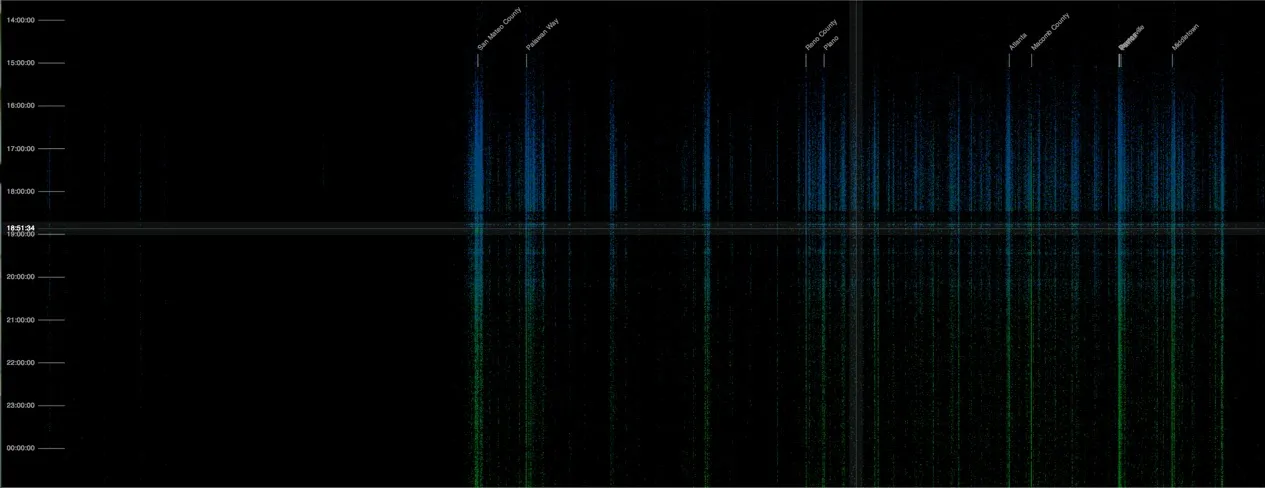
One test laid the streaks over a dark Mapbox map of North America. Another asked Google’s reverse geocoder to name the busiest columns and got San Mateo County, Plano and Atlanta, and once just a street, Palawan Way. For the world view, geocode.js, a small Node.js script, looked up the 1,000 busiest coordinates in advance, waiting two seconds and asking again whenever Google answered OVER_QUERY_LIMIT.
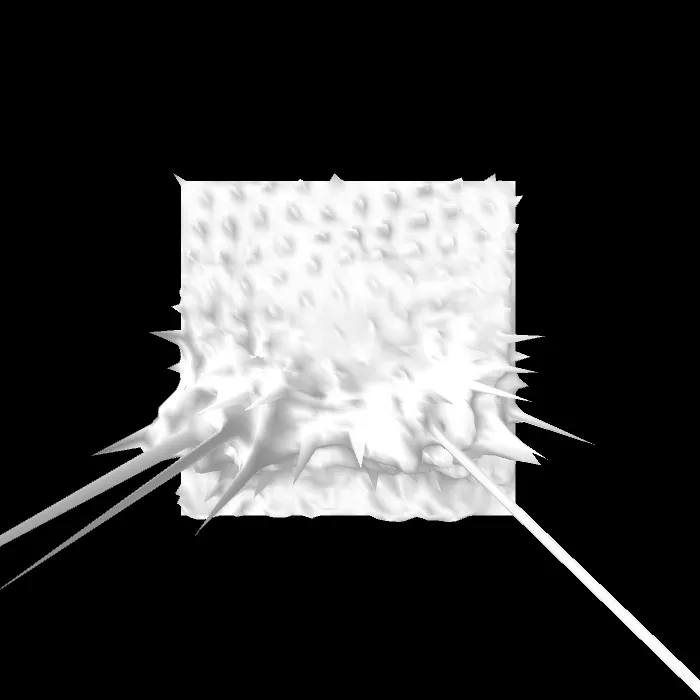
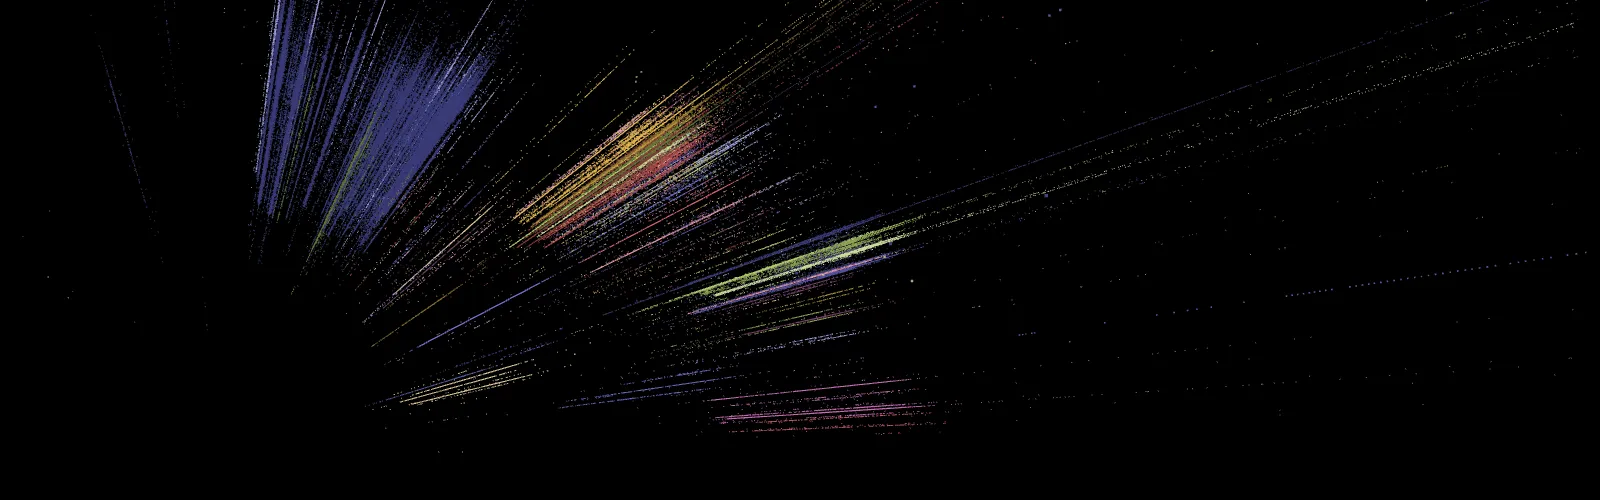
Code RED DNA came out of “Dataviz Challenges”, an experimental course on interactive web data visualization at FH Potsdam in summer 2013, the same course that produced Meteorite Media Impact. My presentation for the course covers both. Its Code RED part opens with the question »Kann man anhand der Rohdaten Muster erkennen?« (can you see patterns in the raw data?) and, as inspiration, Oona Räisänen’s annotated spectrogram of a dial-up modem handshake. Later I moved the points into three.js, and by April 2014 they had become a WebGL particle cloud you can orbit, with each host’s duration as depth. The code is on GitHub (MIT), and the canvas prototype still runs, loading all 26 MB of the table into the browser.
Images
Left and right arrow keys flip through the pile, Enter enlarges the top image.