Border Bumping
Live maps in which roaming cellphones redraw national borders wherever the network disagrees with the cartographers.
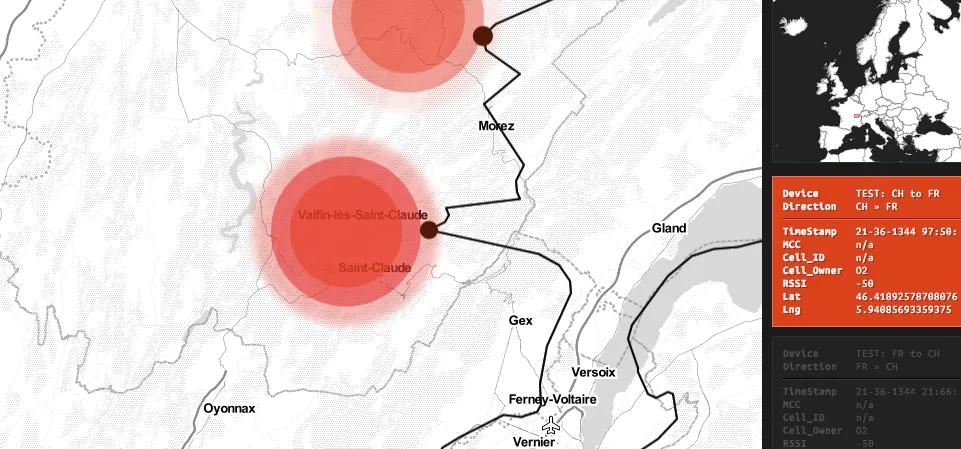
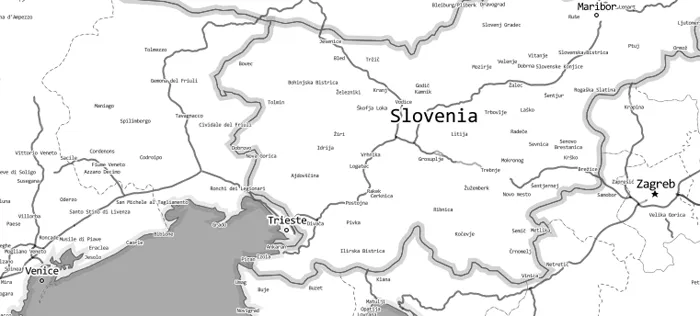
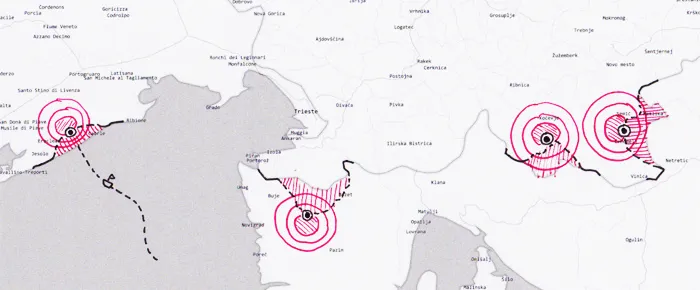
National borders are a construct — a line on a map, a sign by the road. Crossing one usually feels like nothing at all… until your phone buzzes: welcome abroad, roaming charges apply. Often that happens kilometers before or after the official line. Border Bumping takes these cellphone moments seriously: wherever a device registers a border that the map disagrees with, the border itself gets redrawn — the territory as told by cell towers, not cartographers.
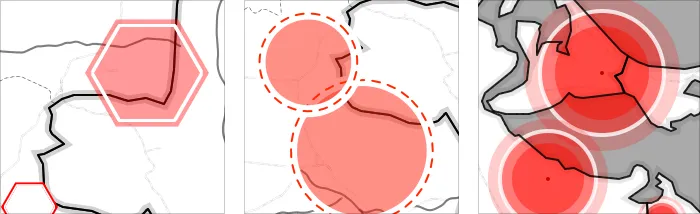
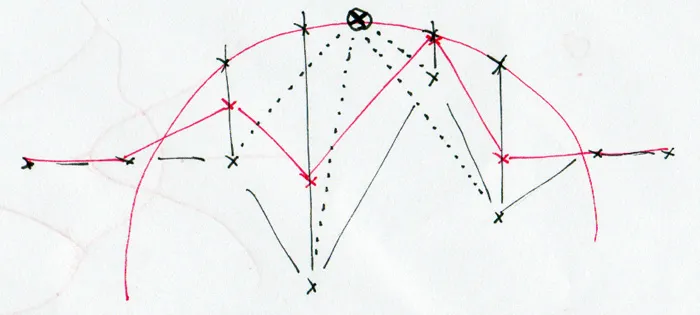
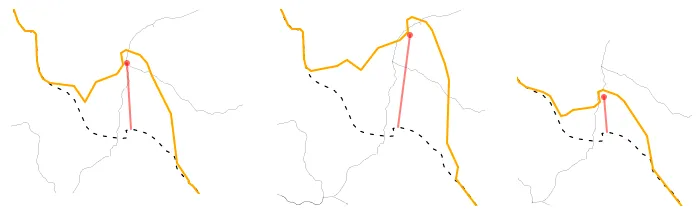
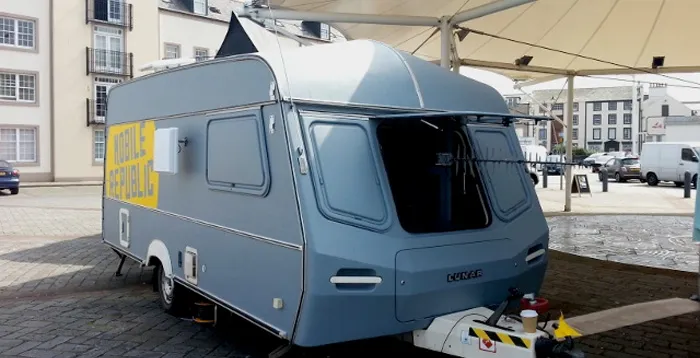
The project was created by Julian Oliver for the Mobile Republic caravan exhibition; I built the visualization side together with Till Nagel — live maps in which the collected “bumps” continuously distort national borders. My part was the animation of the bouncing borders and much of the interface around them (the animated zoom, the popups, and the sidebar where each bump arrives as a ticket), written in JavaScript. Till wrote a detailed account of our design and programming process, and the project was featured on The Creators Project.
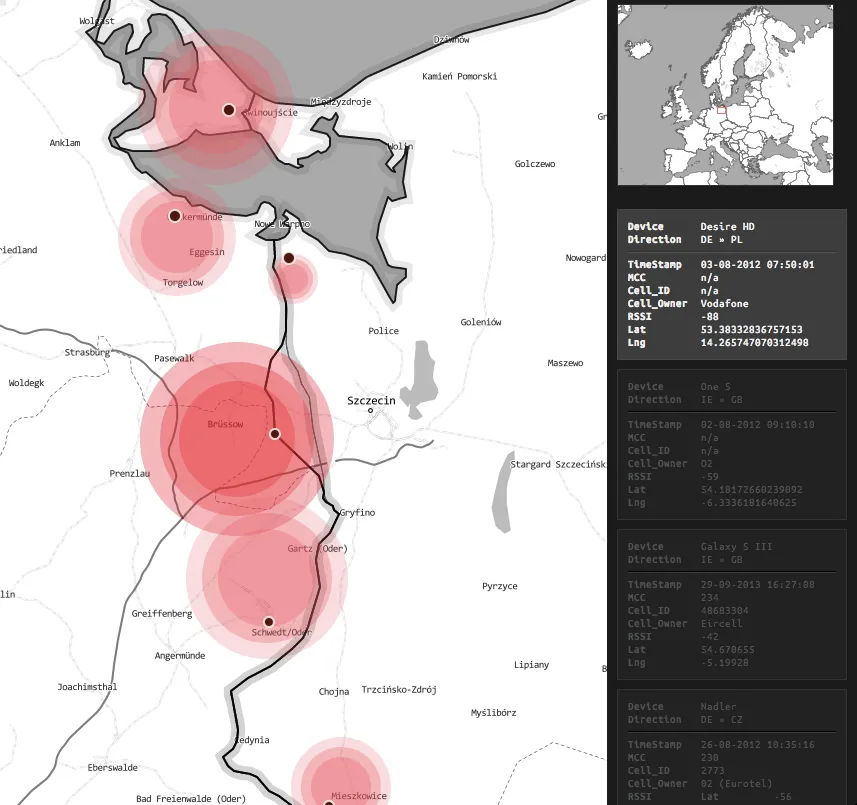
The stack, for the technically curious: TileMill for a toner-like map style served from the caravan’s own server, Natural Earth for the country borders, OpenStreetMap for street and city data, GeoJSON for the interactive border data, Leaflet for a fast multitouch map with SVG rendering, D3 to animate the distortions and read in the bumping data, jQuery/zepto for the lightweight UI — and paper to prototype the ideas in the first place. Built Berlin-hack-style between coffee, beers, and night sessions; the code is open source on GitHub. A demo with test incidents still runs on GitHub Pages: the borders bump as before, but the Stamen base-map tiles under them no longer load.
In 2013 the work was developed further during a short residency at the Techne Institute in Buffalo, New York, and I updated the map for the U.S.–Canada border.
Both collaborations carried on: Till Nagel and I later built cf. city flows (2016), and Julian Oliver and I teamed up again for Deep Sweep Visualization (2015) and HARVEST Visualization (2017).
Images
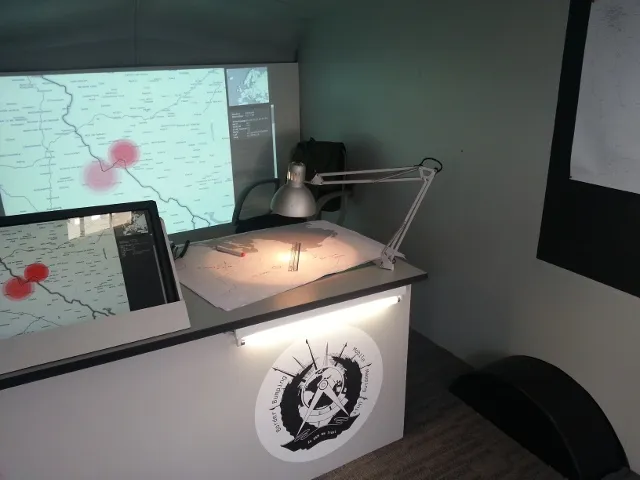
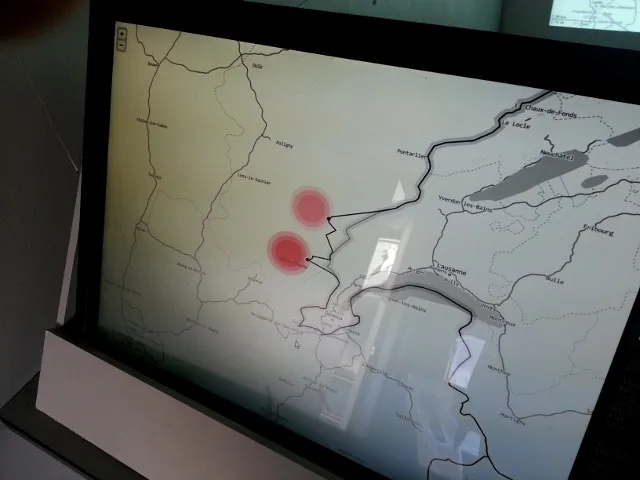
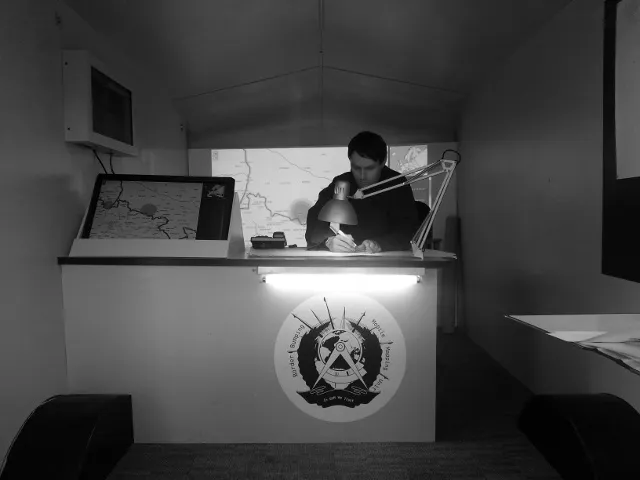
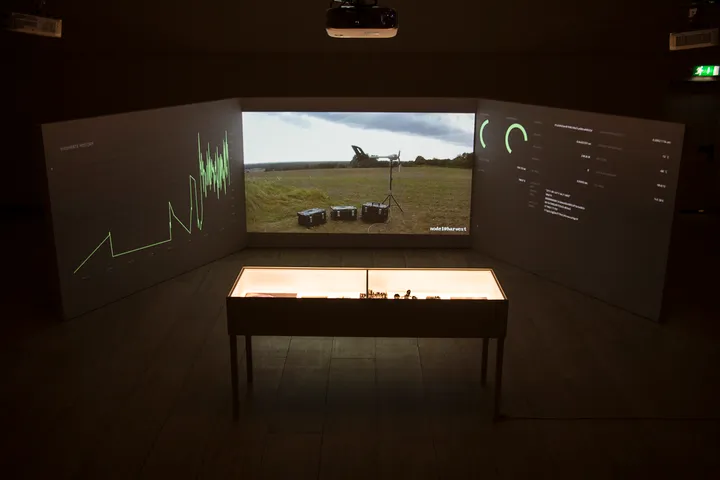
Inside the caravan
Left and right arrow keys flip through the pile, Enter enlarges the top image.