Visuelle Erkundung der Aktivitäten der Finanzlobby
As part of my work with Finanzwende, I collaborated with data journalist Lorenz Matzat to create a data visualization that explored the activities of the financial lobby in Germany. Our goal was to make this complex topic more accessible to the general public by creating a visually engaging and informative article.
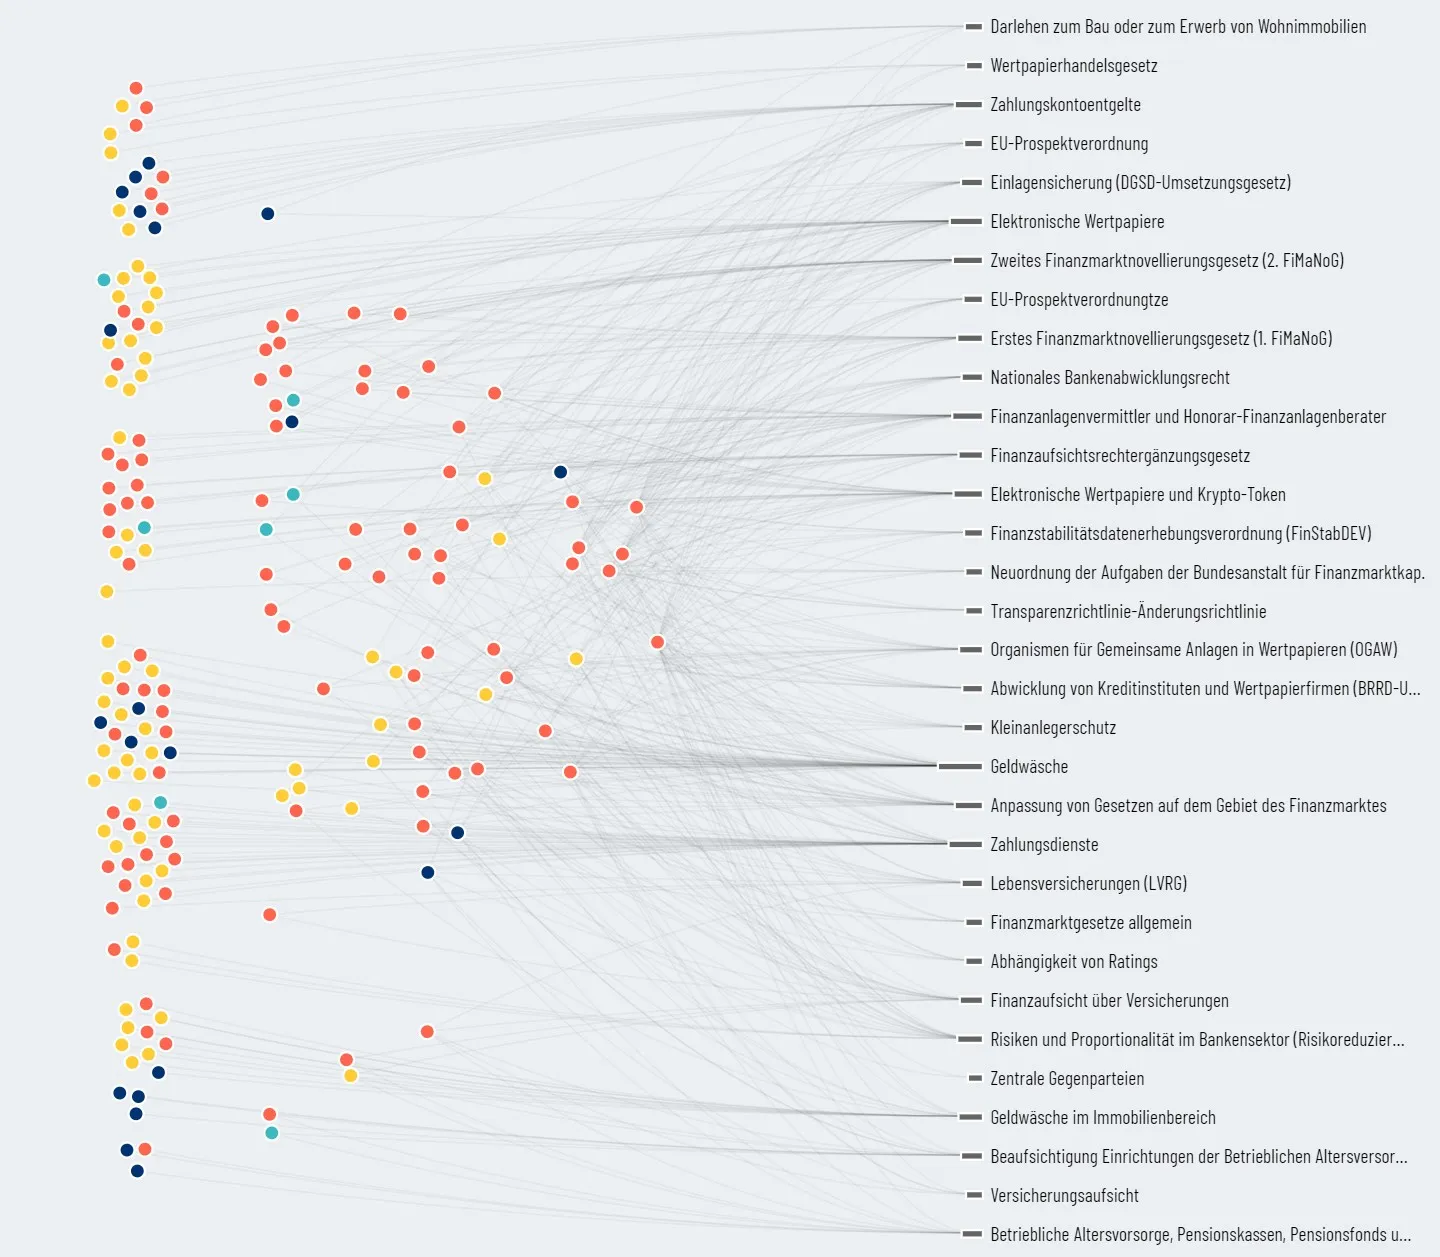
The data we used was gathered from 34 meetings of the Bundestag Finance Committee and 33 drafts of speakers related to the financial market between 2014 and 2020. We wanted to show which associations and companies submitted comments and statements during this period, and how they were connected to one another.
To achieve this, we decided to use a force-directed graph layout created with d3. This type of visualization is particularly effective for showing the relationships between different nodes in a network, which is exactly what we needed for this project. We designed the system to form a network that looks simple and engaging, with different colors and sizes used to highlight the most influential actors.
In addition to the force-directed graph, we also used bar graphs and a treemap to communicate other aspects of the data. The bar graphs show the number of comments and statements submitted by different actors, while the treemap provides a hierarchical view of the different associations and companies involved.
We created the visualizations using d3 and embedded them using ObservableHQ. The end result is a tool that allows users to explore the data in an interactive and intuitive way, gaining a better understanding of the complex world of financial lobbying in Germany.